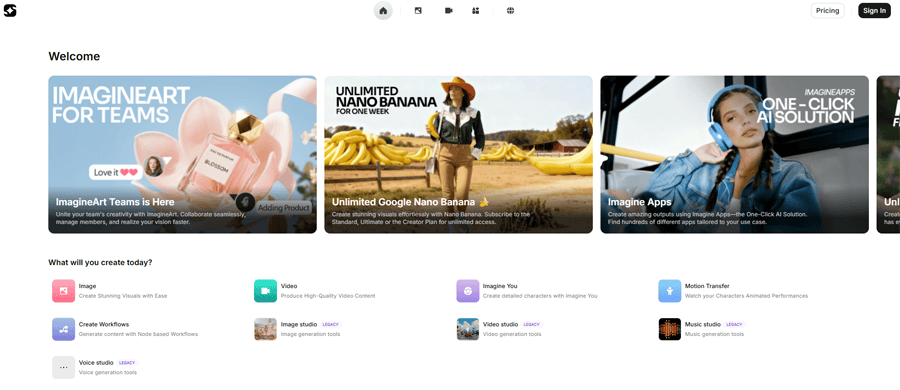
ImagineArt offers an exclusive promo code to save big on your subscription. This offer from ImagineArt AI allows you to get up to 60% off…
Marketing Tools Discounts Category
In this section you can find the best discounts, coupon codes and promotional offers of the most used online marketing tools nowadays (best deals on CRM software, email marketing platforms, landing page builders, conversion tracking and monitoring tools, live chat software,...)
Synthesia AI 35% Off Discount Code – July 2026 Verified
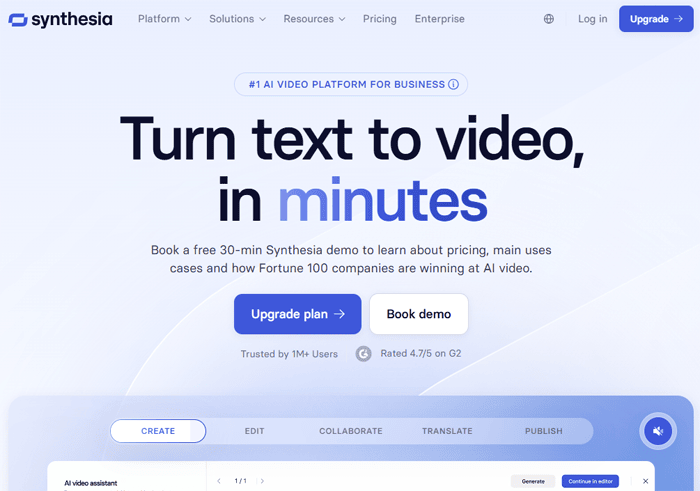
If you’re looking for the best Synthesia discount code to save on your subscription, here’s the deal: a total savings of 35% off to get…
Blaze AI 30% Off Promo Code
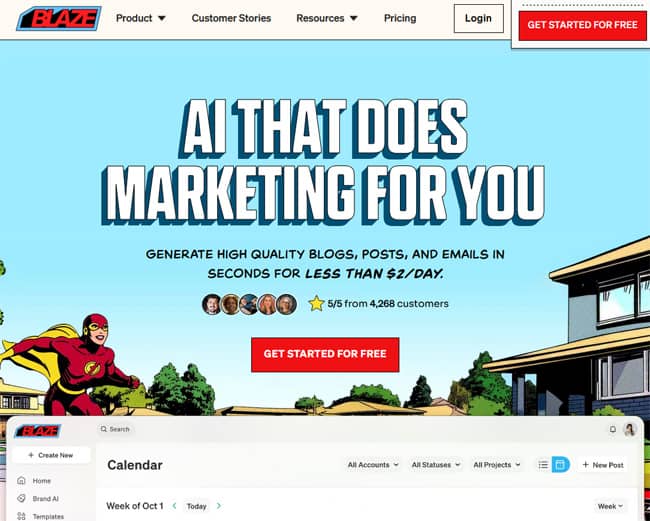
If you’re looking for the best Blaze AI promo code to save on your subscription, here it is: 30% off with the exclusive coupon below….
SellerAmp 22% Off Coupon Code on Annual Plans
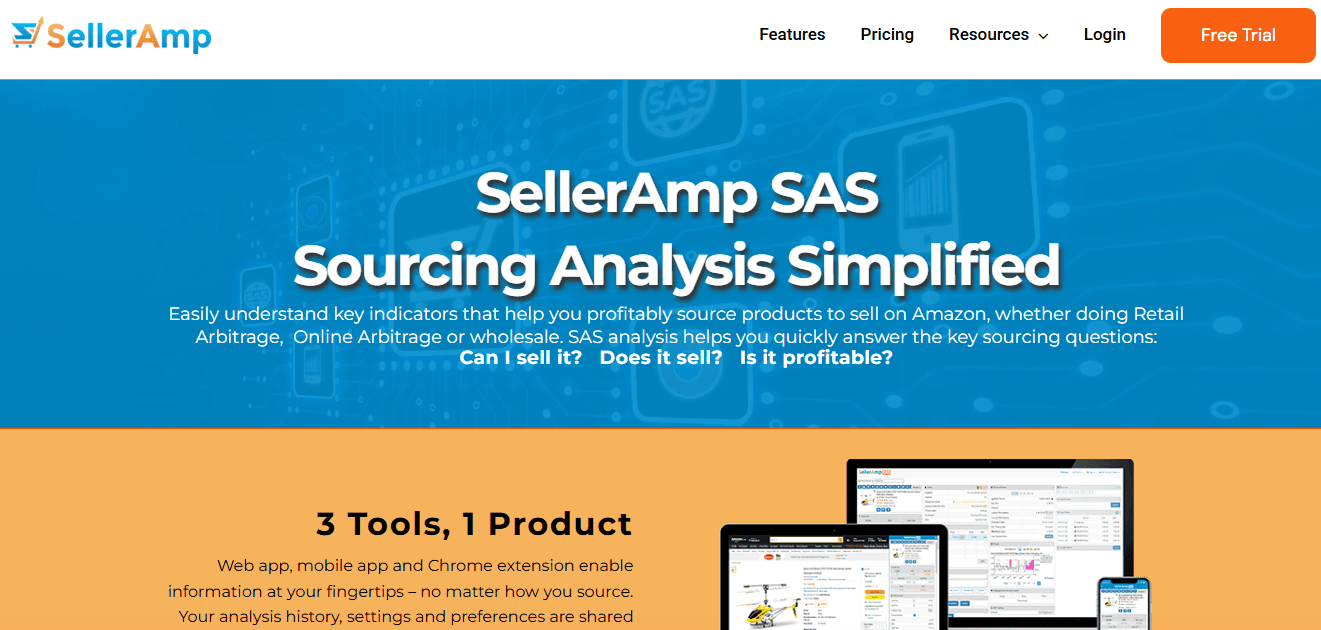
SellerAmp is currently offering an exclusive discount coupon for your first annual subscription. If you’re involved in online arbitrage, retail arbitrage, or wholesale selling on Amazon,…
Views4You 10% Off Promo Code
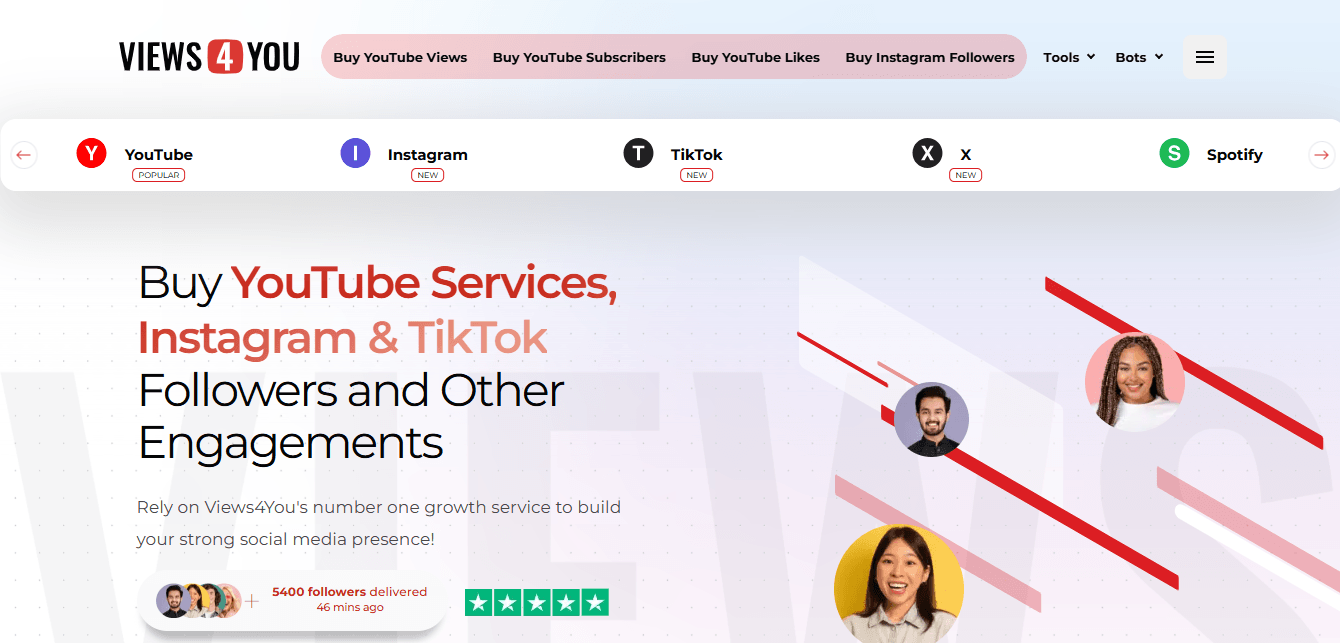
Looking for a simple way to boost your social media visibility without overspending? With the Views4You promo code, you can get 10% off all their…
AMZScout Up to 25% Off Promo Code
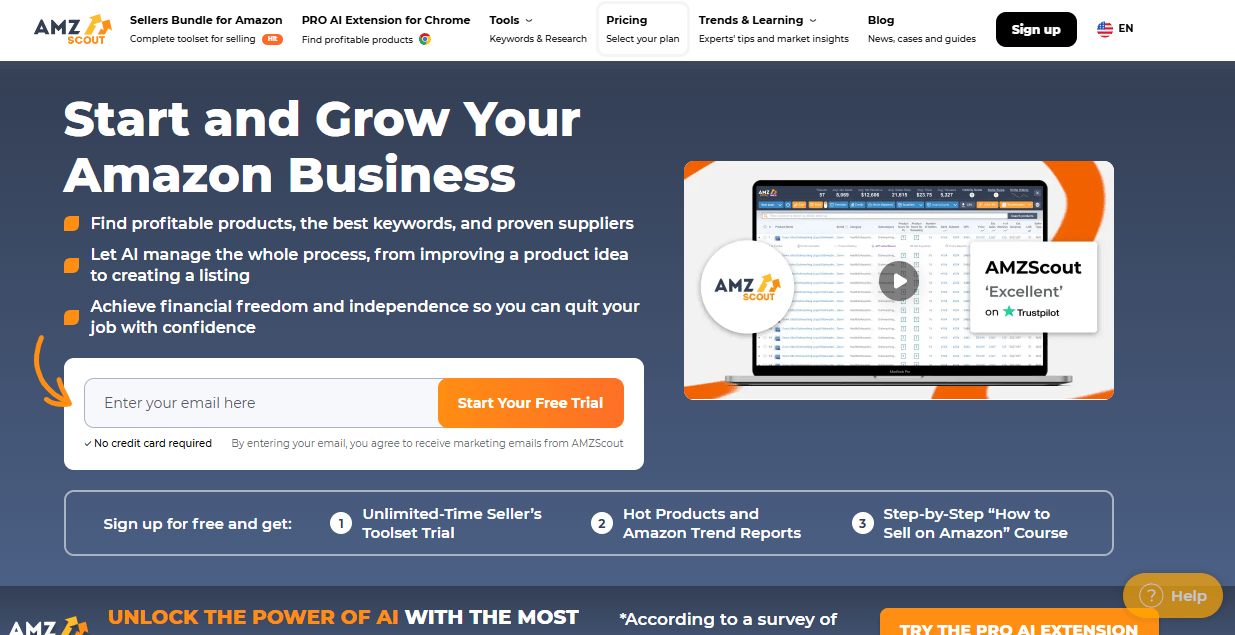
AMZScout stands out as one of the most effective tools available for Amazon sellers. Whether you’re just starting out or you’re already experienced, the AMZScout…
Sellerboard Promo Code 2 Months Free (Save up to $158)
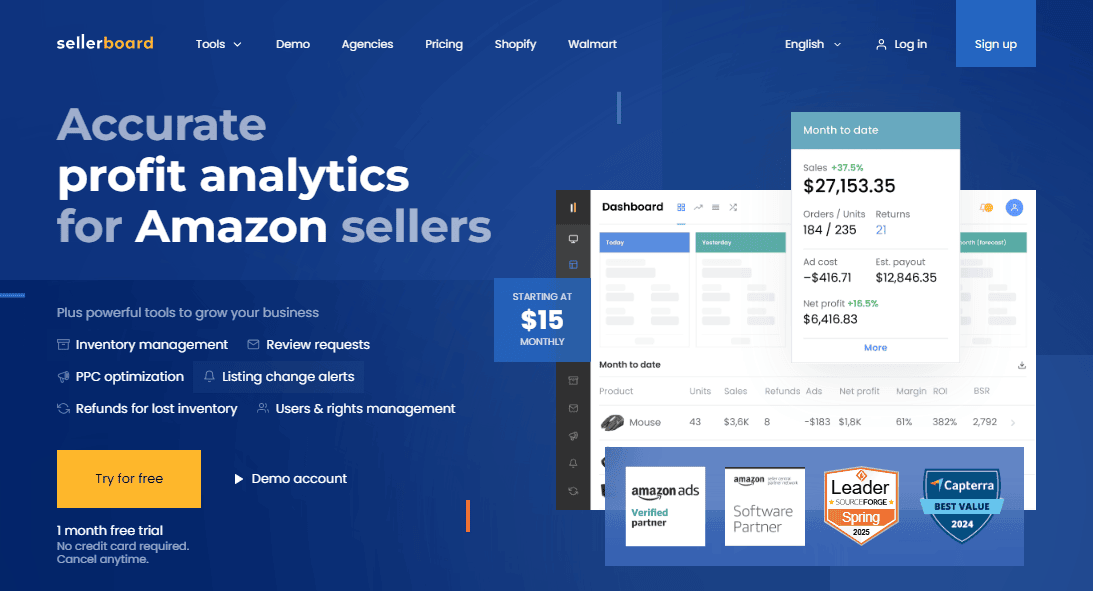
Sellerboard is an advanced profit analytics and automation tool tailored for Amazon sellers. If you’re looking for a precise and efficient way to manage your…
Helium 10 35% Off Coupon Code on Monthly Plans
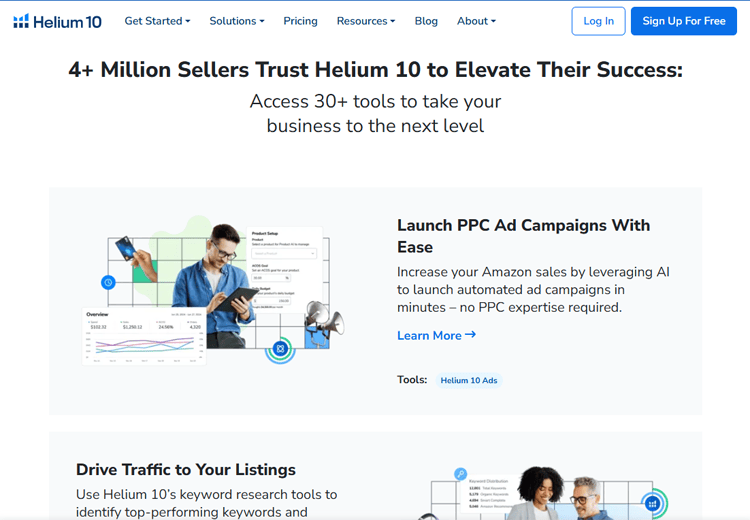
Currently, Helium 10 offers a 35% discount on any monthly plan for 6 Months. This makes the coupon offer more attractive to those who prefer the flexibility…
My Private Proxy Up to 35% Off Promo Code
My Private Proxy is one of the leading platforms for purchasing private proxies, designed for professionals and businesses seeking security, speed, and reliability. Right now,…
Squid Proxies 25% Off Promo Code
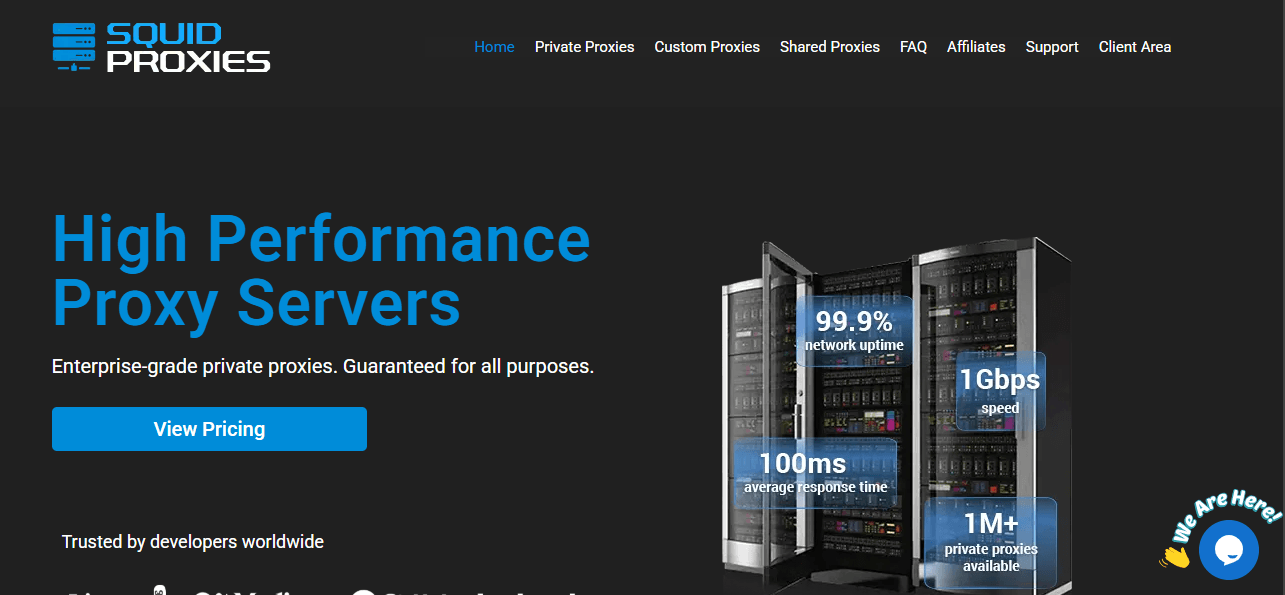
If you’re looking for a fast, secure, and reliable connection to protect your online privacy, manage multiple accounts, or perform web scraping without interruptions, Squid Proxies is…
Traveling Mailbox 10% Off Coupon Code
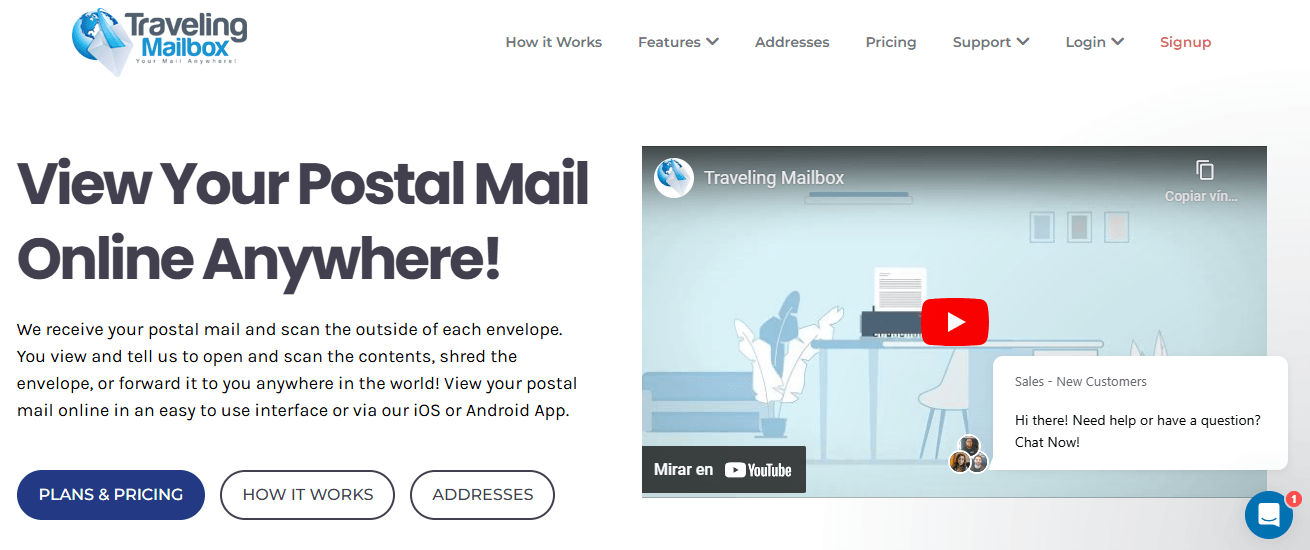
If you need a practical and secure way to manage your postal mail no matter where you are, Traveling Mailbox is the ideal solution. This virtual mailbox…
Invideo AI 20% Off Coupon Code + 50 AI mins Free

If you’re looking for an AI video generator, Invideo is a popular option due to its ease of use and focus on audiovisual content creation….
MemberPress 60% Off Coupon Code
Currently, MemberPress is offering a 60% discount on any of its plans with a promotional code. This is a unique opportunity to access all the premium features of the…
Fliki AI 30% Off Promo Code
Fliki AI is offering exclusive promotions to help you save on your subscription. Depending on the plan you choose, you can take advantage of different…
Minea Up to 50% Off Promo Code
If you want to improve your advertising campaigns and discover the most effective strategies on Facebook, Instagram, and TikTok, this adspy is the ideal tool. Now,…
Post Affiliate Pro 50% Off Coupon Code on Monthly Plans
Post Affiliate Pro is now offering an exclusive coupon code with which you can save 50% off the price of your subscription for the first…
Riverside FM 71% Off Promo Code

Currently, Riverside FM is offering an exclusive discount that will allow you to save a significant amount on your subscription. Depending on the plan you choose,…
TubeBuddy 30% Off Coupon Code
Now, with TubeBuddy you have the opportunity to access a 30% discount on monthly plans using the following coupon code and get access to this…
Pipiads 50% Off Coupon Code
If you’re looking for an effective way to improve your advertising campaigns, Pipiads is the perfect tool. It allows you to spy on and analyze competitor ads…
Scribe 45% Off Promo Code
If you need to document processes, create step-by-step tutorials, or simplify team training, Scribe AI is the perfect tool to do it quickly and automatically. And…
Shutterstock Up to 65% Off Coupon Code
Shutterstock, one of the most recognized platforms for obtaining images, videos, music, and other creative resources, offers a special discount code you won’t want to…
AutoDS 30% Off Coupon Code on Monthly Plans
AutoDS, one of the most comprehensive tools for managing dropshipping businesses, offers an exclusive coupon code on its services. This is your chance to optimize…
Webflow Up to 72% Off Promo Code
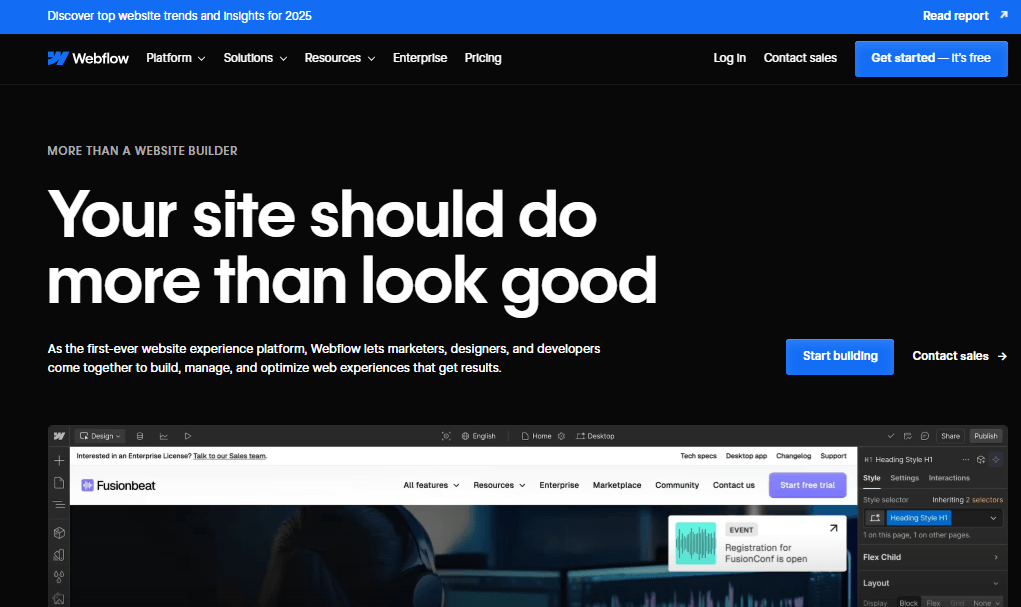
Webflow, one of the leading platforms in web design and development, offers exclusive discounts you can’t miss. If you’re looking to create a professional website…
Pictory 54% Off Coupon Code
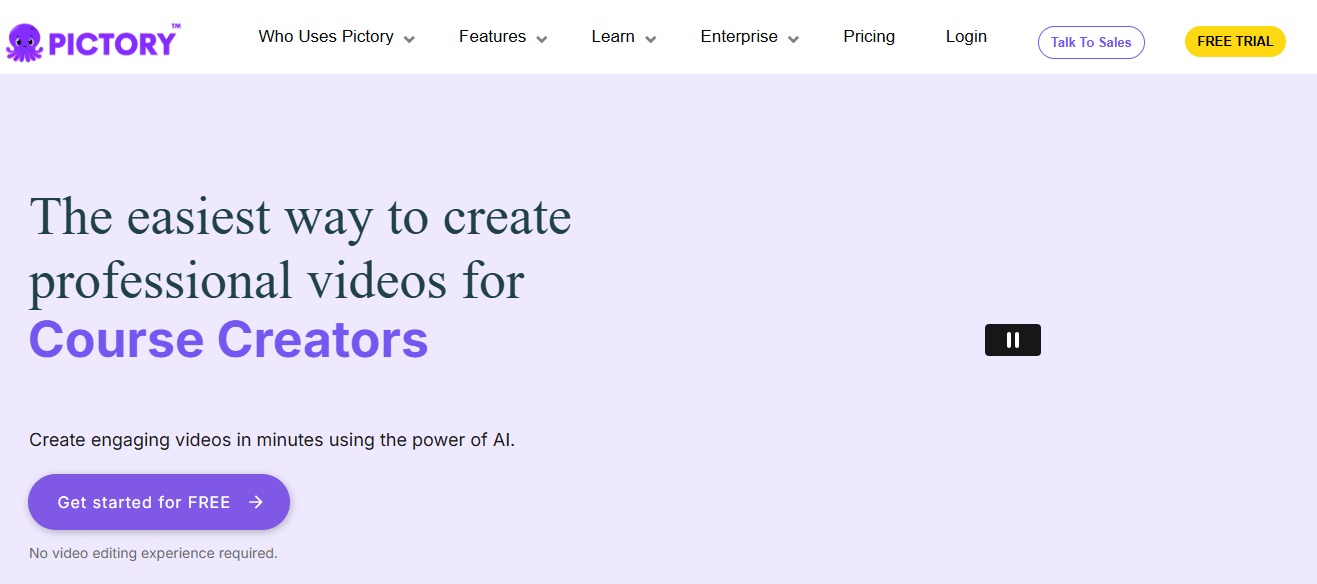
Pictory AI is a tool that transforms how visual content is created. Currently, Pictory is offering a special promotion and a discount that allow you…
Unbounce 35% Off Coupon Code
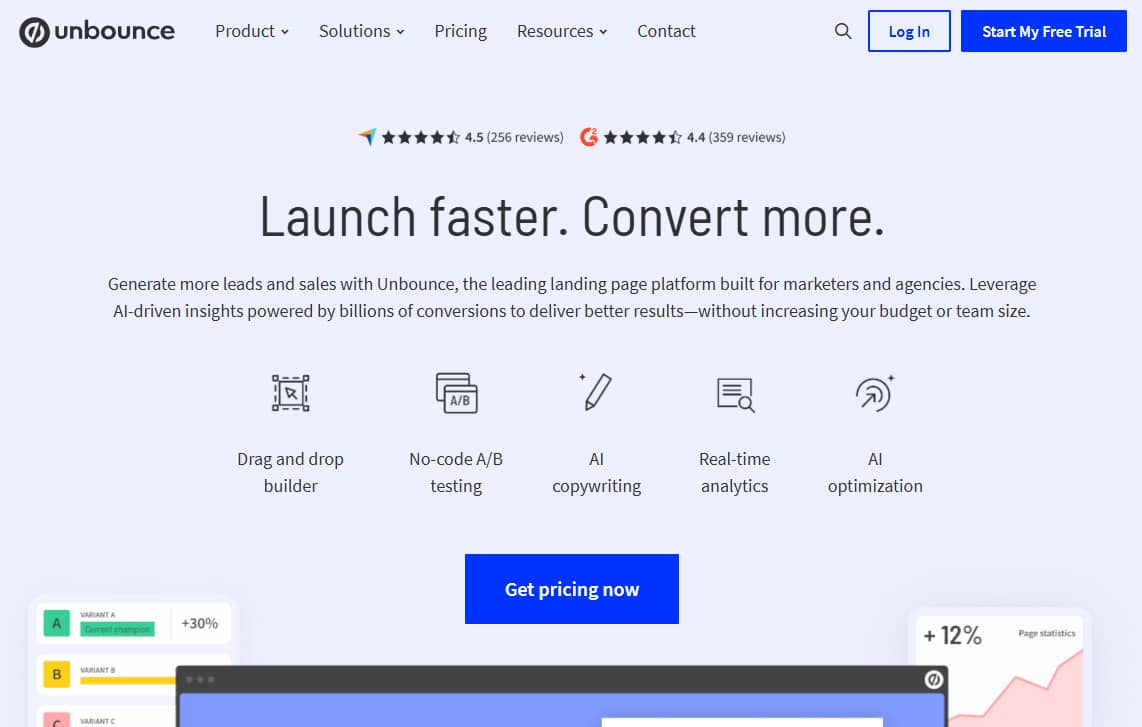
Unbounce is offering a coupon code with which you can get a 35% saving on the purchase of any of their payment plans. If you…
Famety 20% Off Coupon Code to Buy Instagram Followers, Likes and More
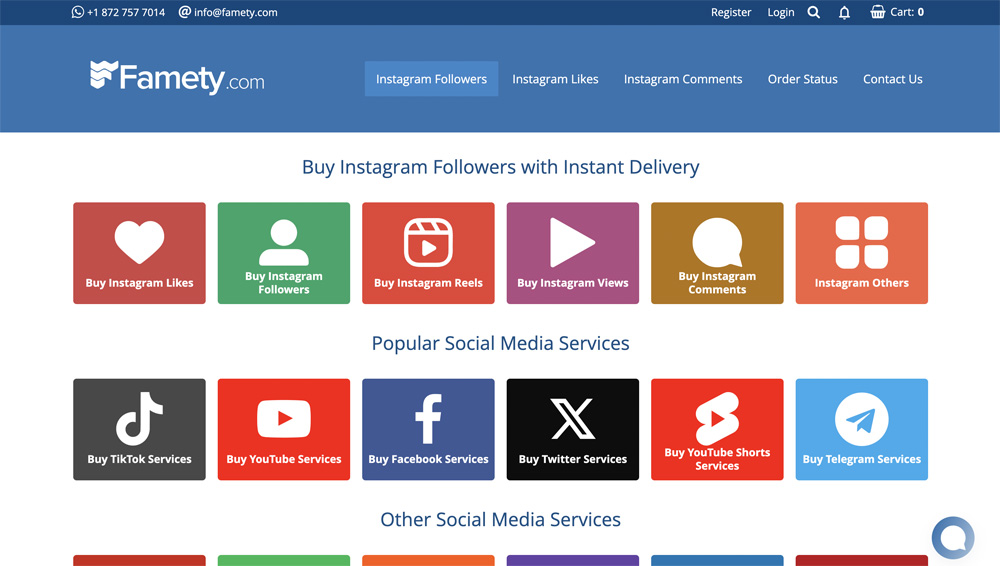
Are you looking to skyrocket your social media presence while saving money? Look no further! We have the perfect solution for you. With our exclusive…
Quillbot 70% Off Discount Code
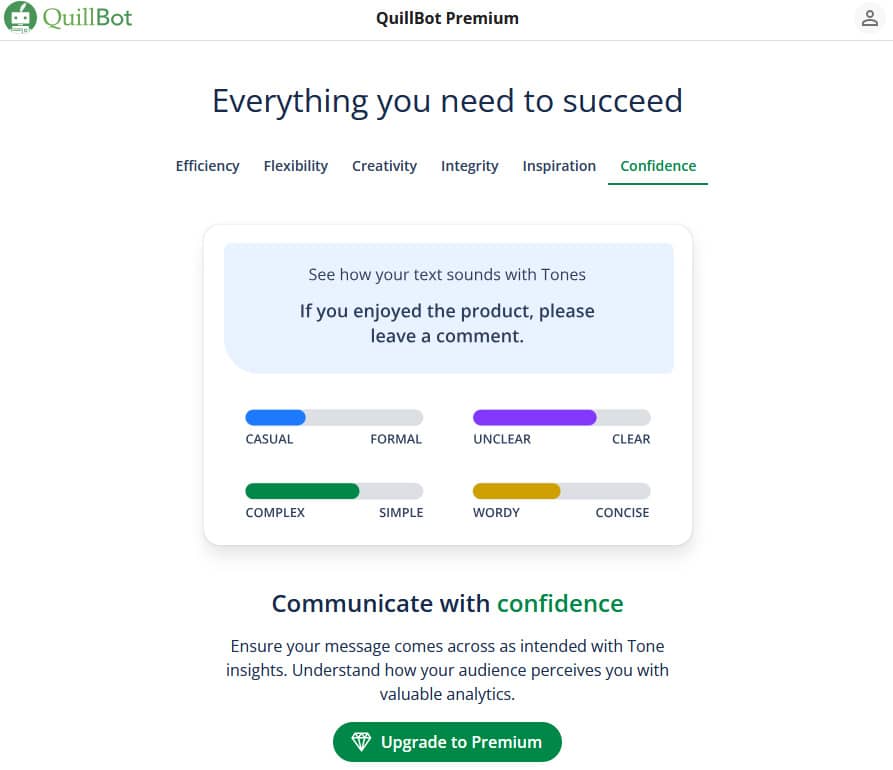
Quillbot is offering an exclusive discount code that lets you save up to 70% on their Premium plan. It’s the perfect opportunity to access advanced…
SmartScout 50% Off Promo Code (July 2026) -Verified
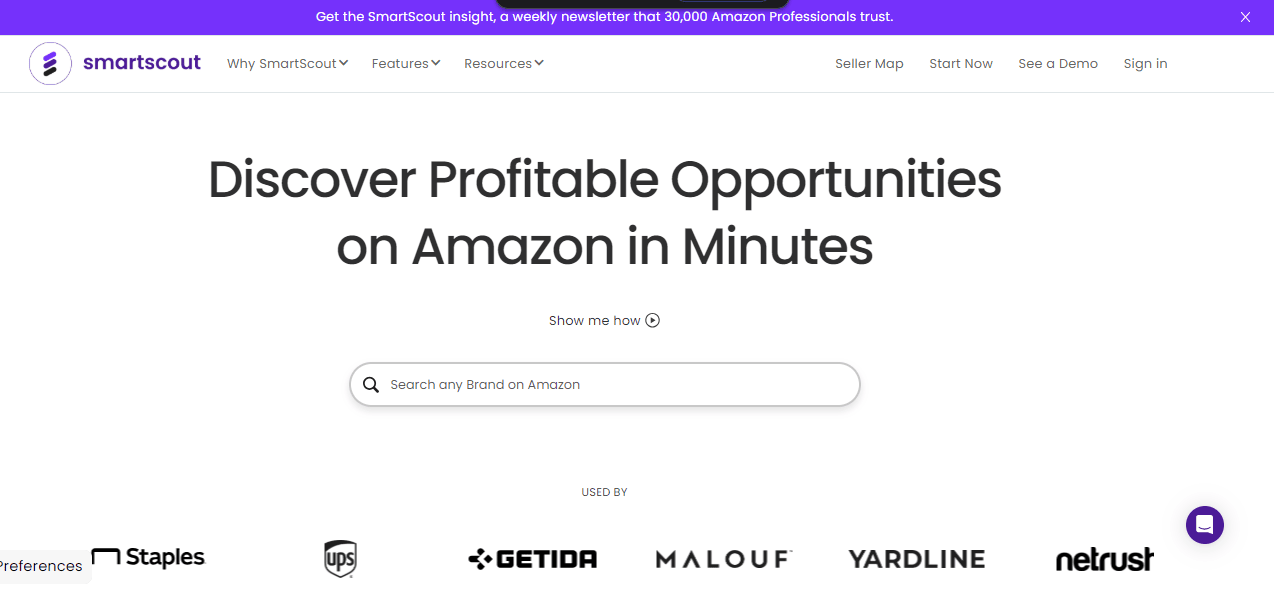
SmartScout is currently offering a promo code with which you can get up to 50% off. It is an excellent opportunity to get into this…
Media Mister 25% Off Coupon Code
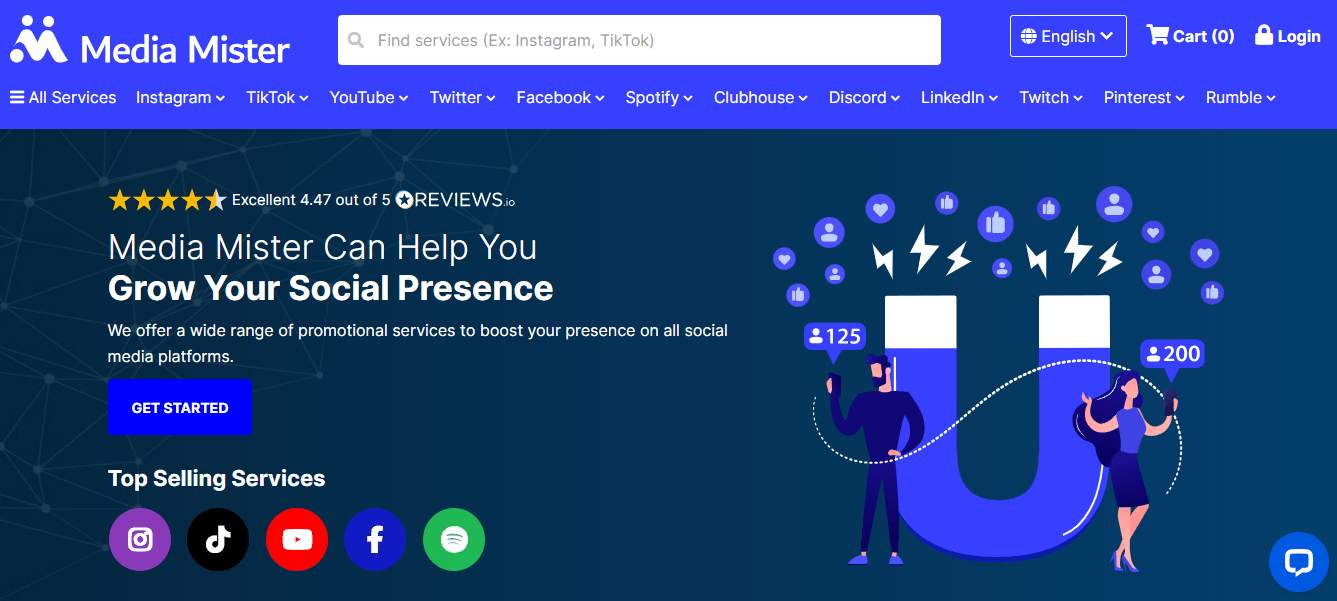
With the use of a simple coupon code, you can receive a 25% discount on any purchase you make within the Media Mister platform, which…
Rytr 47% Off Coupon Code
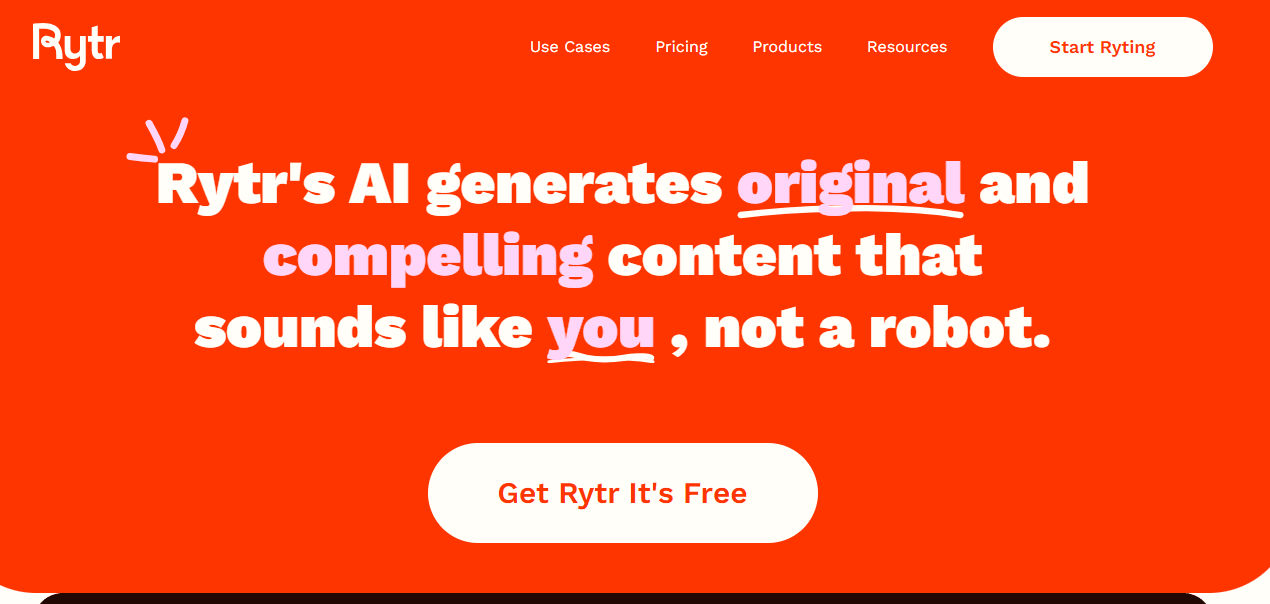
Currently, Rytr is offering a discount of 47% thanks to the use of a coupon code when purchasing one of the available plans. Rytr.me is…
HoneyBook 42% Off Promo Code
HoneyBook is offering an attractive discount up to 42% with the application of a promo code at the time of purchasing one of the plans…
SocialPilot 15% Off Coupon Code
SocialPilot is a platform that facilitates the handling and managing of all your social networks in a single environment. Currently, it is offering different promotions…
Sellfy Up to 38% Off Promo Code
Sellfy is a software specialized in the creation of online stores that, which despite not being one of the best known, has quality features that…
Moosend Up to 45% Off Promo Code
If you are thinking about purchasing Moosend to improve your email marketing strategy, this software offers a promo code with which you can get up…
EngageBay 20% Off Coupon Code
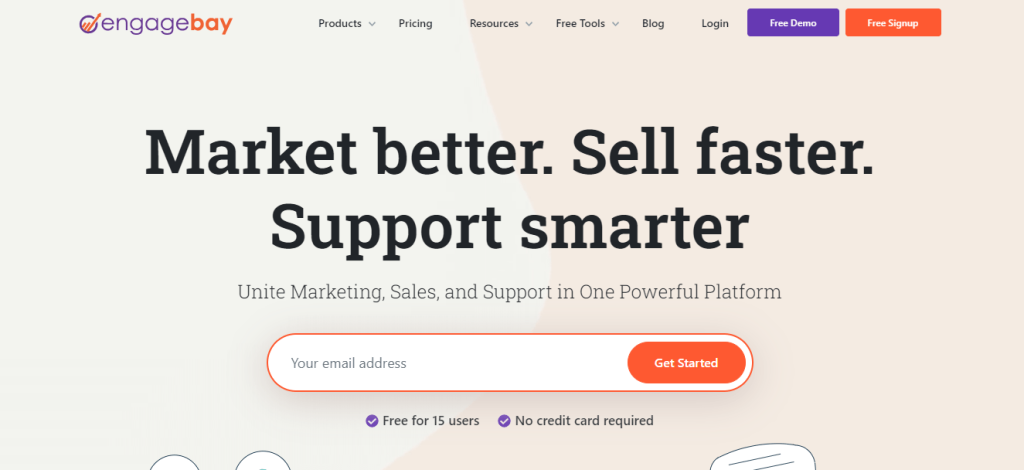
EngageBay is a CRM that offers new customers a 20% discount through a coupon code when purchasing a plan, which you can do with simple…
Omnisend 30% Off Coupon Code on Monthly Plans
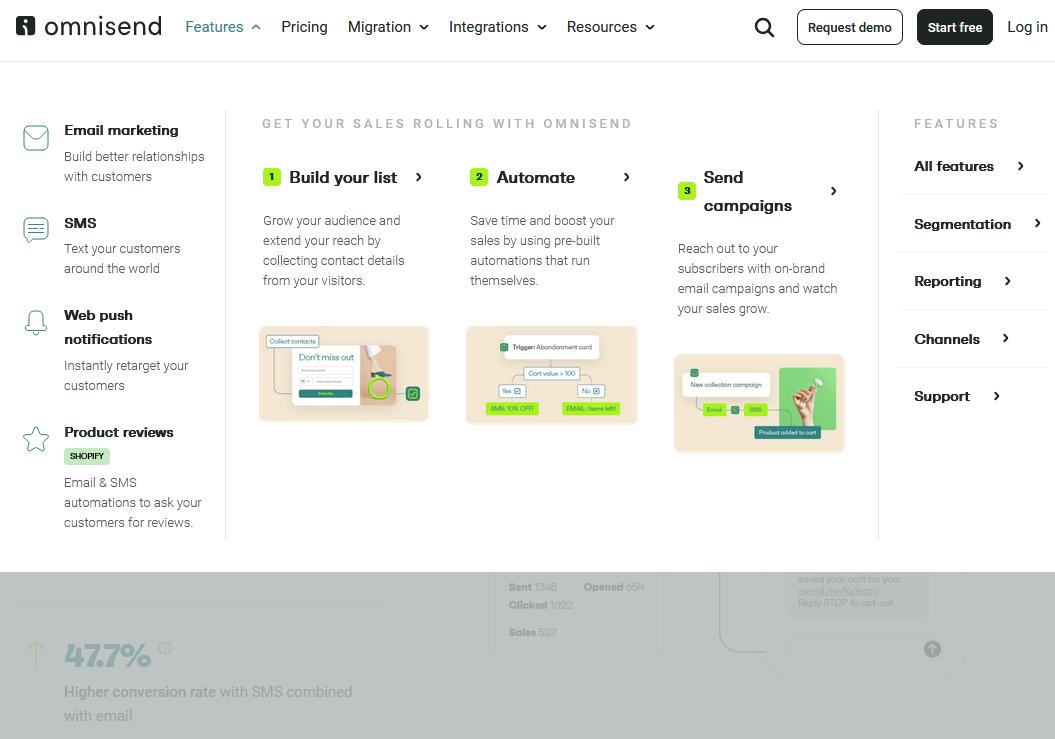
Omnisend, a popular email and messaging marketing tool, is currently offering 30% off their plans. This is due to a limited time coupon code. You…