The GE McKinsey matrix is a product portfolio analysis matrix. When you have a complex product portfolio, then it is difficult for you to take decisions. This is because each product will have its own demands and requirements. But you yourself have limited resources in the company. Thus, what you as a business manager have to look at is to ensure that the firm grows at the optimum rate. For this, you will have to support some products by investing money in them, hold some products by letting them be as they are, and prune other products which are not working as well as you thought. This decision making, on products, is done by the GE Mckinsey matrix.
The GE Mckinsey matrix has two main variables which are plotted on the X and Y axis of the matrix. These variables are the “Market attractiveness” and the “Business unit strength”. Once each product is given a value for its market attractiveness as well as the business unit’s strength, than it is plotted in its right place in the graph. The GE Mckinsey matrix is also known as the nine box matrix, because in the graph, there are nine boxes where the product can be plotted. Once the product is in its place, you can decide the strategy for the product. There are 3 main strategies in the GE McKinsey matrix which are grow, hold and harvest.
GE McKinsey matrix strategies
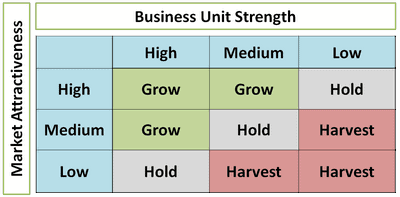
Grow – If the business unit is strong against a strong attractiveness, you grow the business. This means, that you are ready to invest a higher percentage of your resources in these businesses. These business units have high market attractiveness and high business unit strength. They are most likely to be successful if backed up with more resources. The quadrants marked in green are the places where you can grow your business.
Hold – If the business unit strength or attractiveness is average, than you hold the business as it is. It might be that the market is dropping in value, or that there is much high competition which the business unit will be hard put to catch up. In both the cases, the business unit might not give optimum returns even if resources are invested. Thus, in this case, you wait and hold the business unit to see if the market environment changes or if the business unit gains importance in the market as compared to other players.
Harvest – If the business unit or market has become unattractive, than you either sell or liquidate the business or you can hold it for any residual value that it has. This strategy is used in the GE McKinsey matrix when the business unit strength is weak and the market has lost its attractiveness. The best measure in this case is to harvest the weak businesses and reinvest the money earned into business units which are in growth.
Thus, based on the GE McKinsey matrix, you can manage your product portfolio efficiently and can take the right decision of grow, hold or harvest for your products.
Challenges for the GE McKinsey matrix
Like any other strategy, the GE McKinsey matrix has its own challenges. Some of them are mentioned below.
1) Determining market attractiveness is a tough task especially looking at the fast paced market environment. During the dotcom bust, the online market was least attractive. But look where the online market is now.
2) Similarly, determining the strength of the business unit and weighing it against the attractiveness is difficult. Thus, if the variables are not matched properly, you might grow a business which is supposed to be held back and waste unnecessary resources on this business. This might happen if the top management does not know the core competency of the business units.
3) Companies will be limited by resources even if the business unit falls in the growth criteria. Thus, out of 50 products, if 25 fall in growth criteria, what does the management do when it has limited resources? Taking decisions again becomes difficult.
Overall, the GE McKinsey matrix is an improvement over the BCG matrix. Where the BCG matrix only has 4 quadrants with focus on business unit and market share, the McKinsey matrix is a finer example of plotting the actual market conditions against the firms potential to stand up in the current market. Thus, business decisions taken via the GE McKinsey matrix are likely to be spot on.
Liked this post? Check out the complete series on Strategy
This matrix is great especially for Black Friday and Christmas products of the past. You do a superb job inter-connecting your subjects, and great explanatory style.