Gold trades over $5 billion in daily volume, making XAU/USD one of the most liquid and continuously quoted instruments in the world. Unlike stocks that close at the end of the trading day, the gold price moves around the clock from Sunday evening through Friday close, driven by trading activity across Asian, European, and American sessions in sequence.
That continuous movement is what makes tracking the gold price in real time genuinely useful rather than a background curiosity. XAU/USD has moved 41.82% over the past year, trading within a 52-week range of $3,120 to $5,595 – a swing of nearly $2,500 per ounce. For anyone holding physical gold, trading gold CFDs, or managing a portfolio with commodity exposure, knowing where the price sits right now and what it has done recently is the starting point for every decision.
Table of Contents
What You Are Actually Tracking
The price commonly quoted as “gold price” is the spot price – the current market rate for immediate delivery of one troy ounce of gold, denominated in US dollars. This is the XAU/USD pair, where XAU is gold’s internationally recognised currency code derived from its chemical symbol.
Spot price and futures price are not identical. Gold futures trade on the COMEX exchange and reflect the expected price at a future delivery date, typically carrying a small premium over spot due to financing costs. For most retail traders and investors tracking gold as a price signal, spot price is the relevant number. Futures matter when you are analysing the forward curve or trading futures contracts directly.
The spot price moves continuously because it is determined by the global over-the-counter market, a decentralised network of banks, dealers, and institutions trading directly with each other. What you see on a charting platform is a composite of these quotes, updated in real time.
The Main Tools for Real-Time Gold Price Tracking
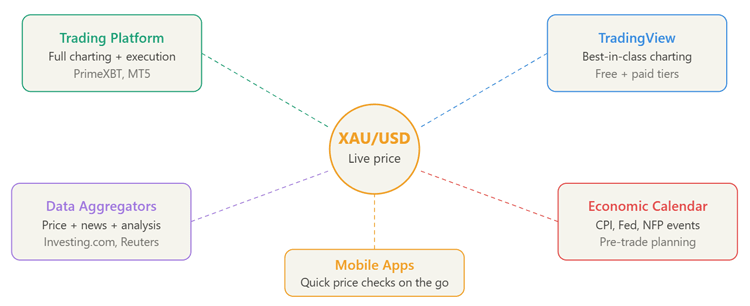
Several categories of tools serve different needs, from simple price checks to full technical analysis environments.
Trading platform charts are the most fully featured option for active traders. Platforms that offer gold CFD trading display live XAU/USD price with complete charting capabilities, candlesticks across multiple timeframes, technical indicators, drawing tools, and order management. The live gold price chart at PrimeXBT displays real-time XAU/USD data with TradingView-powered charting, covering everything from tick data to monthly charts in one interface.
Financial data aggregators like Investing.com, TradingView, and Bloomberg provide live XAU/USD quotes with historical data, technical analysis summaries, and news feeds. These platforms offer customisable chart types including candlestick patterns, area charts, bar charts, and Heiken Ashi, with dozens of built-in technical indicators. For traders who want independent charting outside their broker’s platform, TradingView’s XAU/USD chart is the most widely used.
Economic calendar tools are essential context alongside the price chart. Gold is highly sensitive to specific scheduled events – US CPI releases, Federal Reserve interest rate decisions, non-farm payrolls, and geopolitical developments. Momentum indicators and key Fibonacci levels are most meaningful when read alongside upcoming economic events that could trigger sharp directional moves. Checking the calendar before entering a gold position prevents getting caught on the wrong side of a news-driven spike.
The table below compares the main tracking tools across the dimensions that matter for practical use:
| Tool type | Real-time data | Charting depth | News integration | Best For |
|---|---|---|---|---|
| Trading platform (PrimeXBT) | Yes | Full - TradingView | Yes | Active traders, CFD positions |
| TradingView | Yes | Full - best in class | Community analysis | Charting, technical analysis |
| Investing.com | Yes | Good | Strong | Price monitoring, fundamentals |
| Bloomberg / Reuters | Yes | Basic | Comprehensive | Institutional context |
| Mobile price apps | Yes | Minimal | Headlines only | Quick price checks |
| Economic calendar | N/A | N/A | Scheduled events | Pre-trade planning |
What Drives Gold Price Moves You Should Watch For
Tracking gold price in real time is more useful when you understand what moves it. Several factors consistently produce the largest intraday and swing movements.
US dollar strength has the most consistent inverse relationship with gold. The XAU/USD pair tracks the gold-dollar relationship in real time, meaning dollar rallies typically push gold lower and dollar weakness pushes it higher. Watching the DXY dollar index alongside XAU/USD gives you immediate context for whether a gold move is gold-specific or dollar-driven.
Interest rate expectations move gold significantly. Higher real interest rates increase the opportunity cost of holding gold – which pays no yield – making it less attractive relative to bonds. Fed communications, particularly FOMC statements and press conferences, produce some of the sharpest XAU/USD moves of any scheduled event. The 52-week range of $3,120 to $5,595 reflects how dramatically these macro forces can shift the gold price over a sustained period.
Geopolitical risk generates safe-haven demand. Wars, financial crises, and political instability drive capital into gold as a store of value. These moves are less predictable from a schedule but often produce the most sustained price trends.
Central bank demand – particularly from China and India – continues driving approximately 67% of global gold demand, making institutional buying flows an important background factor for longer-term price direction.
Practical Tips for Gold Price Monitoring
Set price alerts rather than watching a chart continuously. Every serious trading platform and most financial apps allow you to set notifications for when XAU/USD crosses a specific level. This is more efficient than monitoring a screen and prevents the emotional decision-making that comes from watching every tick.
Use multiple timeframes. A real-time 1-minute chart shows you noise. The daily chart shows you the structure. Both are useful, but they answer different questions. Check the daily and 4-hour charts to establish context and direction, then use shorter timeframes for timing entries and exits.
Track volume alongside price. A gold price move on high volume is more meaningful than the same move on thin participation. Most platforms show volume on gold CFDs or futures, giving you a quick read on whether a breakout has real conviction behind it.
Conclusion
Real-time gold price tracking has moved from a specialised institutional capability to something available to any trader with a smartphone. The challenge is not accessing the data – it is knowing which tools to use for which purpose and what context to apply when price moves.
For active traders, a full-featured charting platform with live XAU/USD data, technical analysis tools, and direct trade execution covers all practical needs in one place. For investors monitoring exposure rather than actively trading, a combination of a reliable price aggregator and an economic calendar provides sufficient situational awareness. The price is always available. Understanding what it means requires the tools and context to interpret it properly.