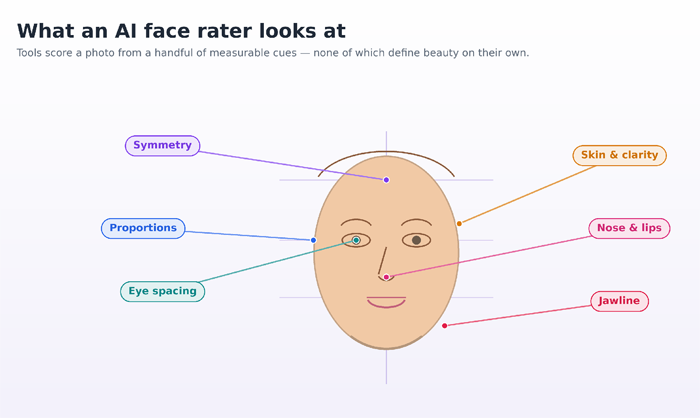
Face rating is an AI feature that scores a photo of your face, usually out of 10, with a breakdown across cues like symmetry, proportions,…
Marketing Category
The Marketing category has detailed articles, concepts and How-tos to help students and professionals learn the concepts and applications.
The Affiliate Marketing Fraud Problem Nobody Wants to Talk About
Affiliate marketing has built some of the largest digital businesses of the past two decades. Done well, it aligns incentives beautifully: brands pay only for…
Why Strong Brand Strategy Is Essential for Long-Term Business Growth

Brand strategy is one of those business concepts that sounds like theory until a competitor with an identical product charges twice the price and wins,…
A Practical Guide to Preparing Personal Documents for International Applications

A personal document can look ordinary at home and still become the record that slows down a visa file, university application, overseas job offer, or…
The Real Reason Most Law Firms Stay Invisible Online and How the Smart Ones Don’t
Ask ten law firm partners why their firm isn’t ranking better online and you will get ten different answers. The website needs updating. We tried…
What Makes Link Building Important for SaaS Startups?
As a modern and updated audience, we understand how important SaaS is in the technically sound world. It has replaced a lot of problem-causing software…
Fast-Track Your TikTok: How Celebian Gets Creators Noticed

It can be hard when you start on TikTok. You put a lot of time into making a funny video, doing a dance, or showing…
How to Train Non-Tech Clients to Use Shopify: Practical Teaching and Support that Actually Works

Let’s be honest, most non-tech clients don’t fear Shopify, they fear breaking something important at 6 p.m. on a Friday. The antidote isn’t a thick…
How to Optimize Content Creation Flow for Bloggers & Marketers
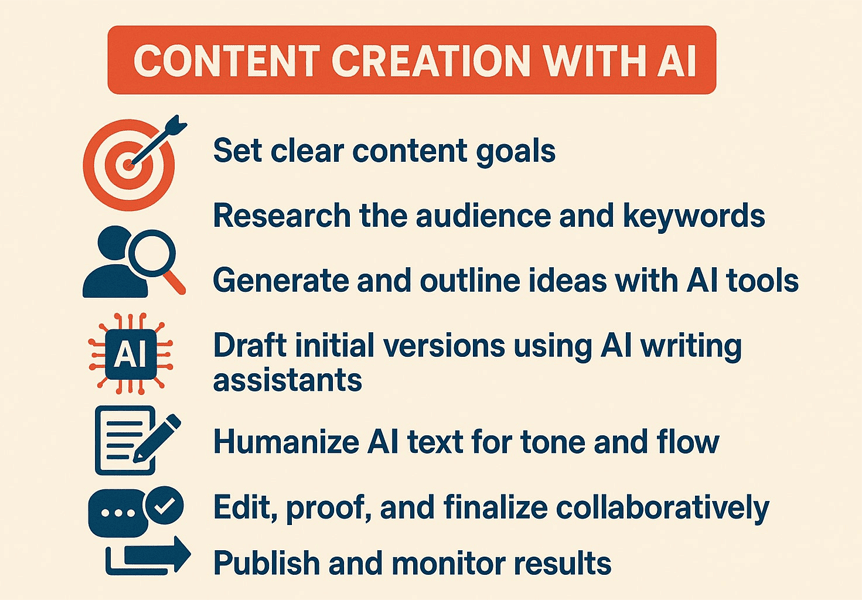
Content creation often feels like a long race that never ends. Bloggers and marketers juggle ideas and edits while trying to keep quality high and…
Marketing Lessons Students Can Learn from Real-World Brand Campaigns

Strong marketing does more than sell. It solves problems and earns trust. Students can learn these habits by looking closely at brands that ship real…
Optimizing Your TikTok Funnel: From Views to Loyal Followers

On TikTok, everything moves extremely fast. Users watch many videos in just a few seconds. For any content creator or brand, the big goal is…
How to Integrate Follower Buys into Your Social Media Strategy

The number of followers you have can indicate to others that you are a trustworthy person or company. Many brands and influencers buy followers. They…
The Role of AI Tools in Modern Content Writing and Marketing

It is no secret that artificial Intelligence is transforming the landscape of content writing and marketing today, right? For businesses, there is no problem running…
How Marketing Students Can Find a Reliable Copywriting Service

Marketing students often have to juggle demanding schedules: assignments pile up, deadlines loom, and professors expect high-quality written work. In addition, learning to communicate effectively…
Trust-Based Acquisition: Unlocking Growth Through Recommendations

In a marketplace flooded with digital noise, how do you get potential customers to listen? The answer lies in trust. Rather than relying on impersonal…
Essential Cybersecurity Tools Every Digital Marketer Should Use
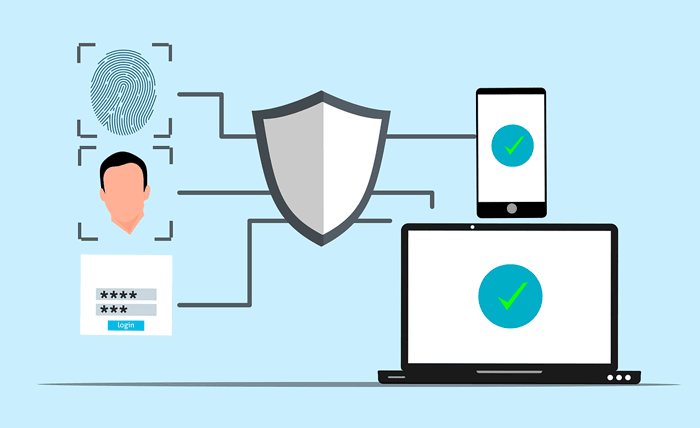
Digital marketers handle a wide range of sensitive data nowadays, and according to a report by IBM about data breaches , the average cost of…
How to Write Marketing Research Papers

Writing a marketing research paper should not just be an academic exercise to pass a course: it is a good opportunity to demonstrate your analytical…
How Students Can Start a Career in Marketing: How to Get Into Digital Marketing

Entering the world of digital marketing can seem complicated. There are too many options, many different roles, and growing competition. But the good news is…
How to Ensure Originality in Your Content: A Marketer’s Guide to Plagiarism-Free Writing

Every marketer knows that the originality of content defines the difference between building lasting brand loyalty and fading into the background noise. Apart from failing…
Essential Tools Every Modern Marketing Team Should Use

When I first started working with marketing teams, one thing became clear fast: without the right tools, even the most creative ideas can fall flat….
What is Demarketing? Types, Examples & Benefits
Demarketing occurs when a company reduces demand for its product or service due to inadequate supply or excessive promotion and distribution expenditures in some locations,…
3 Ways to Build a Connection with Customers and Project Retail Charm

We live in a hyper-connected world with consumers becoming more discerning than ever. They yearn for authenticity and a genuine relationship with brands that reflect…
What is Consumer Marketing? Definition, Strategies & Example
Definition Consumer marketing is about knowing what drives individuals to buy a product and then devising techniques that appeal to their emotions. It is a…
Advertising Weight: Definition, Importance & Examples
What is Advertising Weight? Advertising Weight refers to the measure of exposure that a particular ad campaign garners, individually or within a pool of campaigns….
Advertising Copy: Definition, Types & Tips
What is an Advertising Copy? Advertising copy refers to the branded content in advertisements that aim to persuade the target audience to take a specific…
What are the 4 R’s of Marketing?
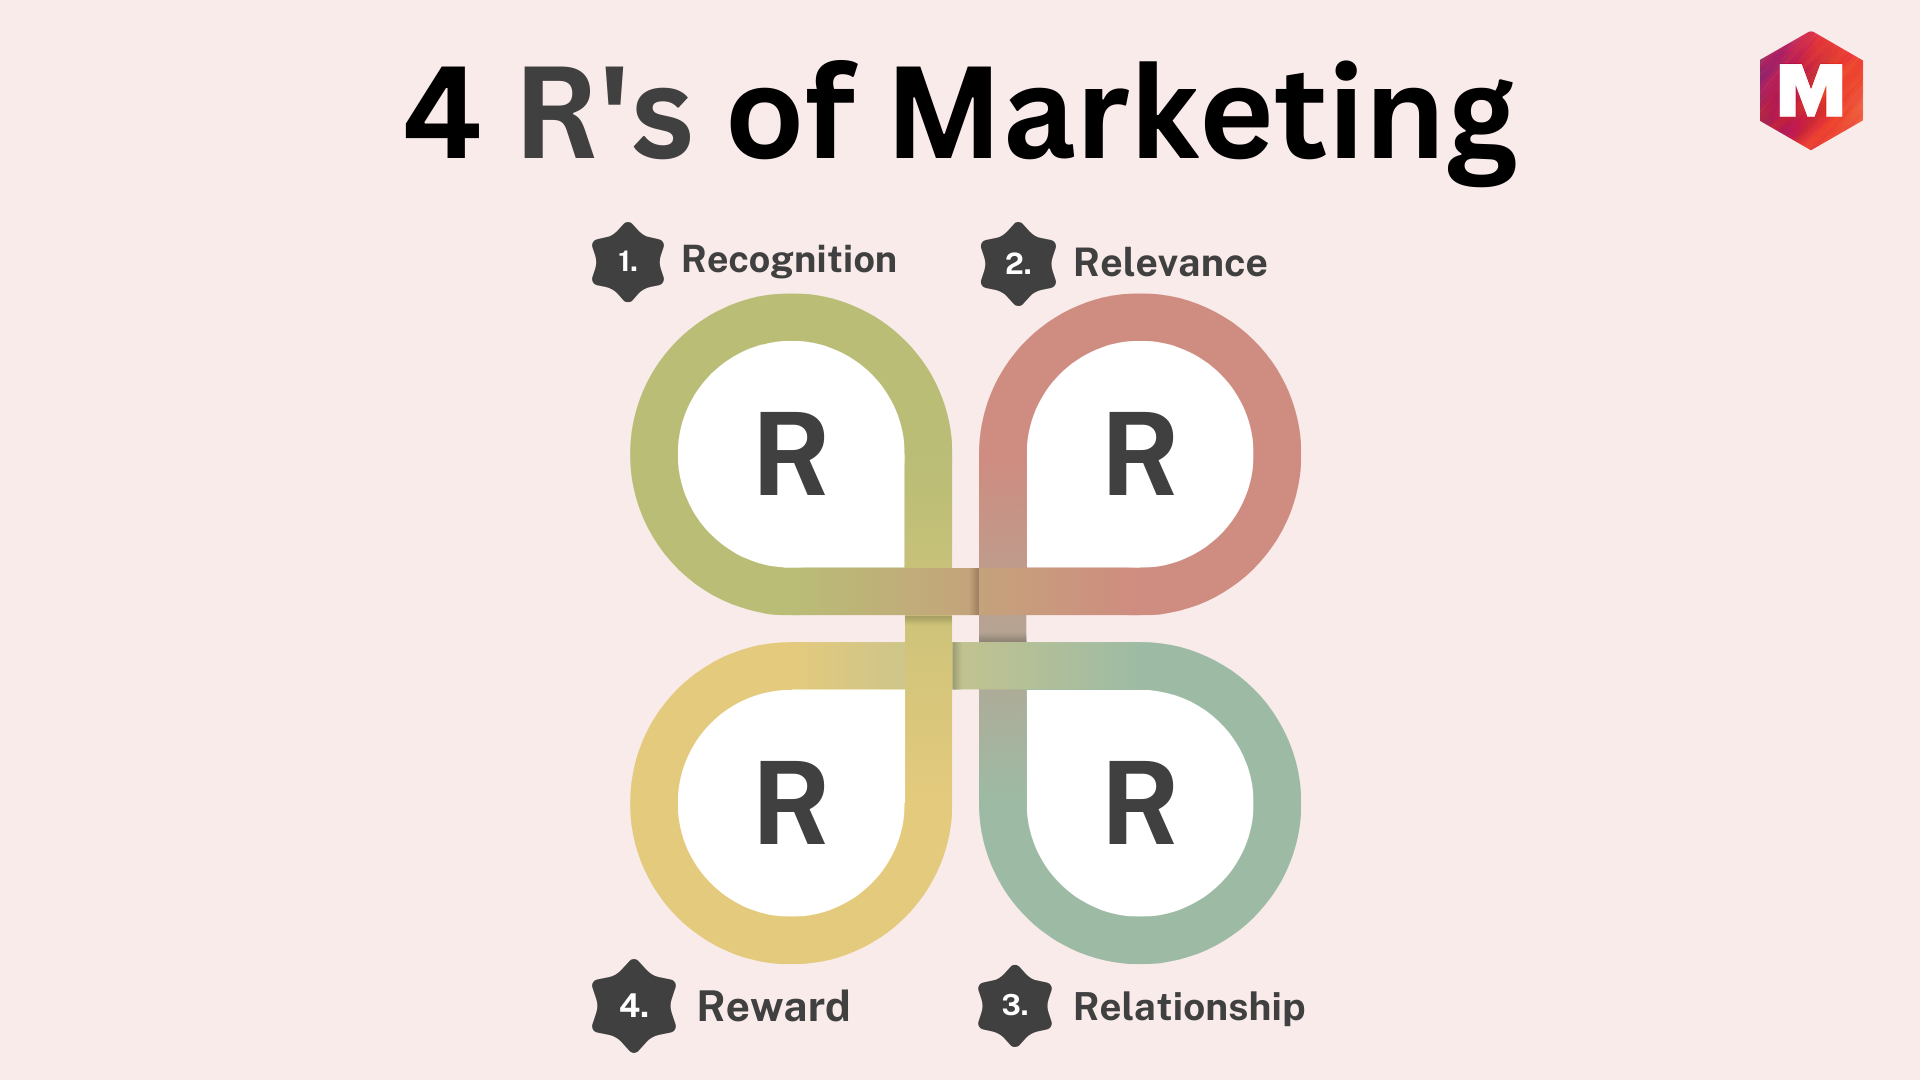
When it comes to successful marketing efforts, there are four key components that play a crucial role in achieving success. These are commonly known as…
Oligopoly: Definition, Characteristics, Types and Examples
The characteristics of an oligopolistic market structure include interdependent decisions, a kinked demand curve, and competitive behavior among firms. Interdependence means that each firm takes…
Leveraging Secondary Brand Associations to Build Brand Equity
Leveraging secondary brand associations is a way of associating with another entity or brand to help you build brand equity, expand into new markets, and…
Brand Hierarchy: Definition, Types, Models and Examples
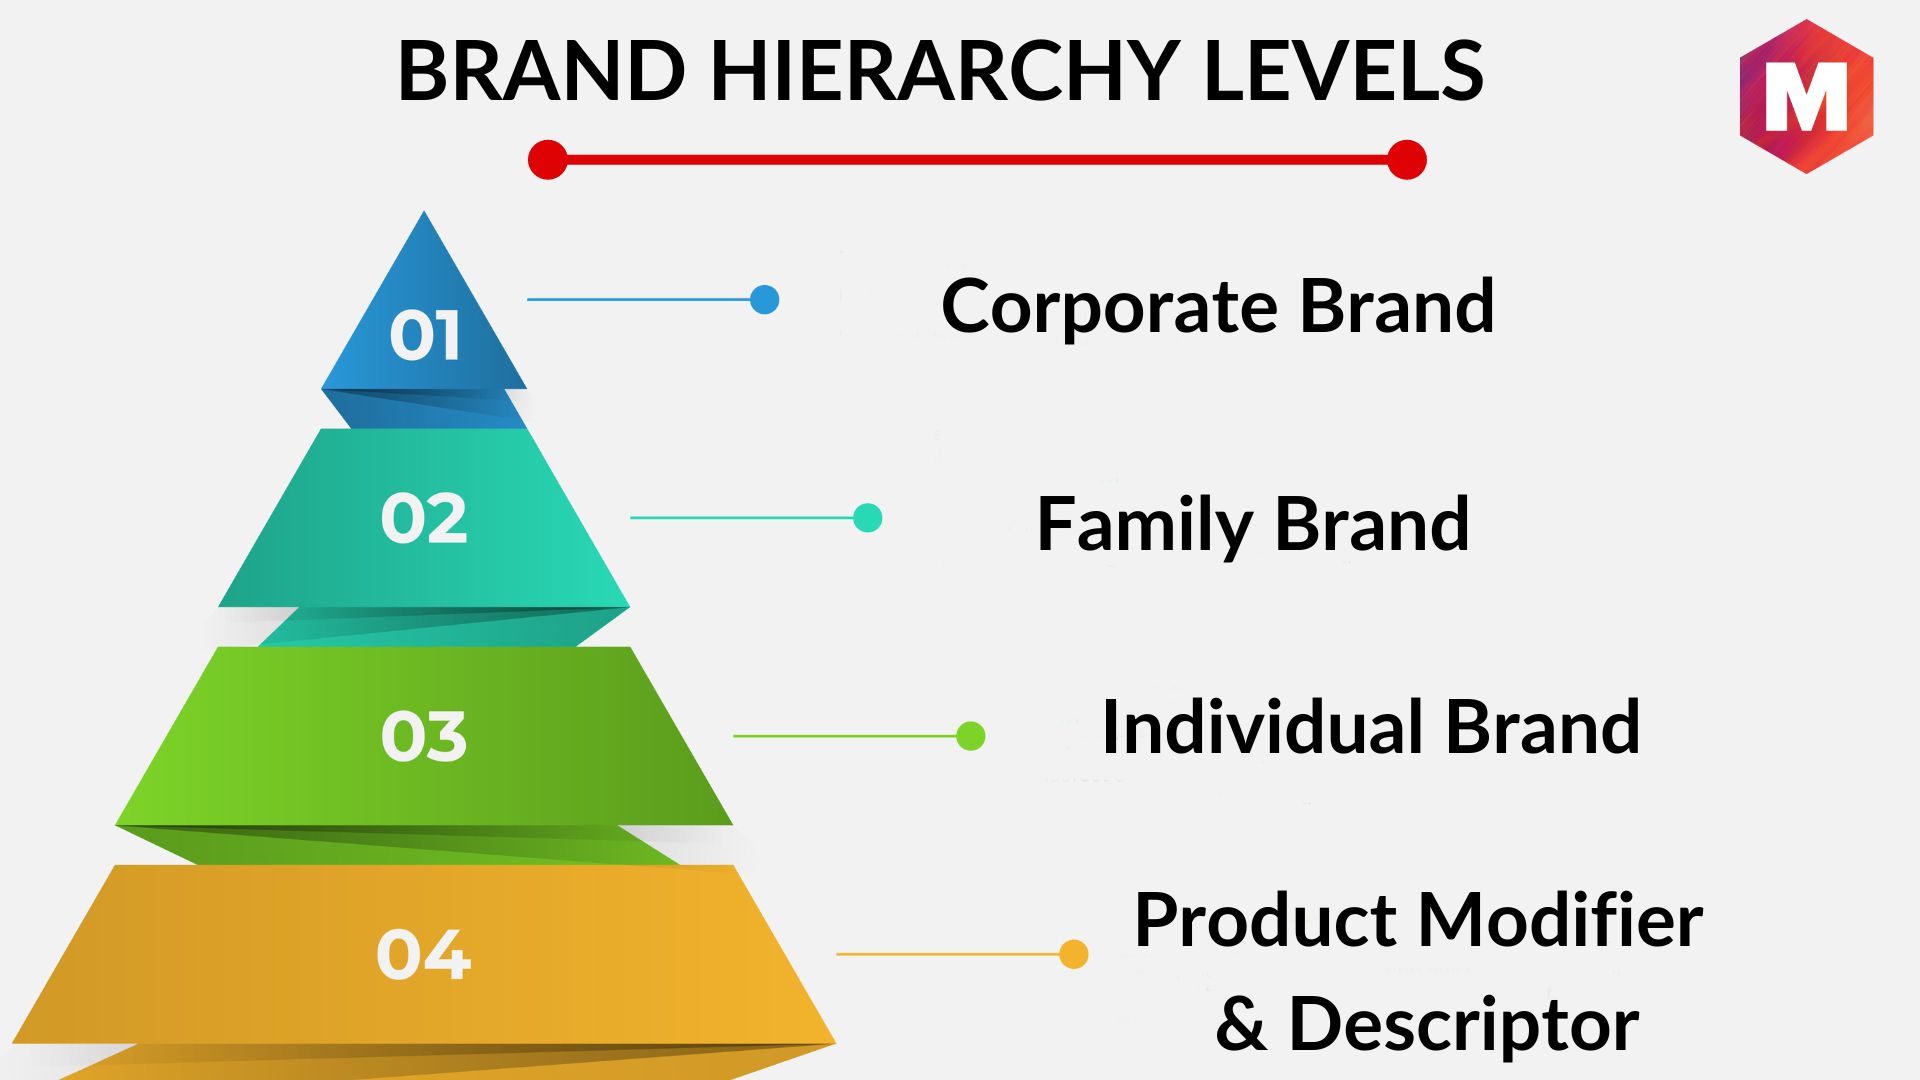
What Is Brand Hierarchy? Brand hierarchy is the organizational structure of a company’s brand portfolio. It outlines the relationships between a brand’s different elements, and…
The Brand Value Chain
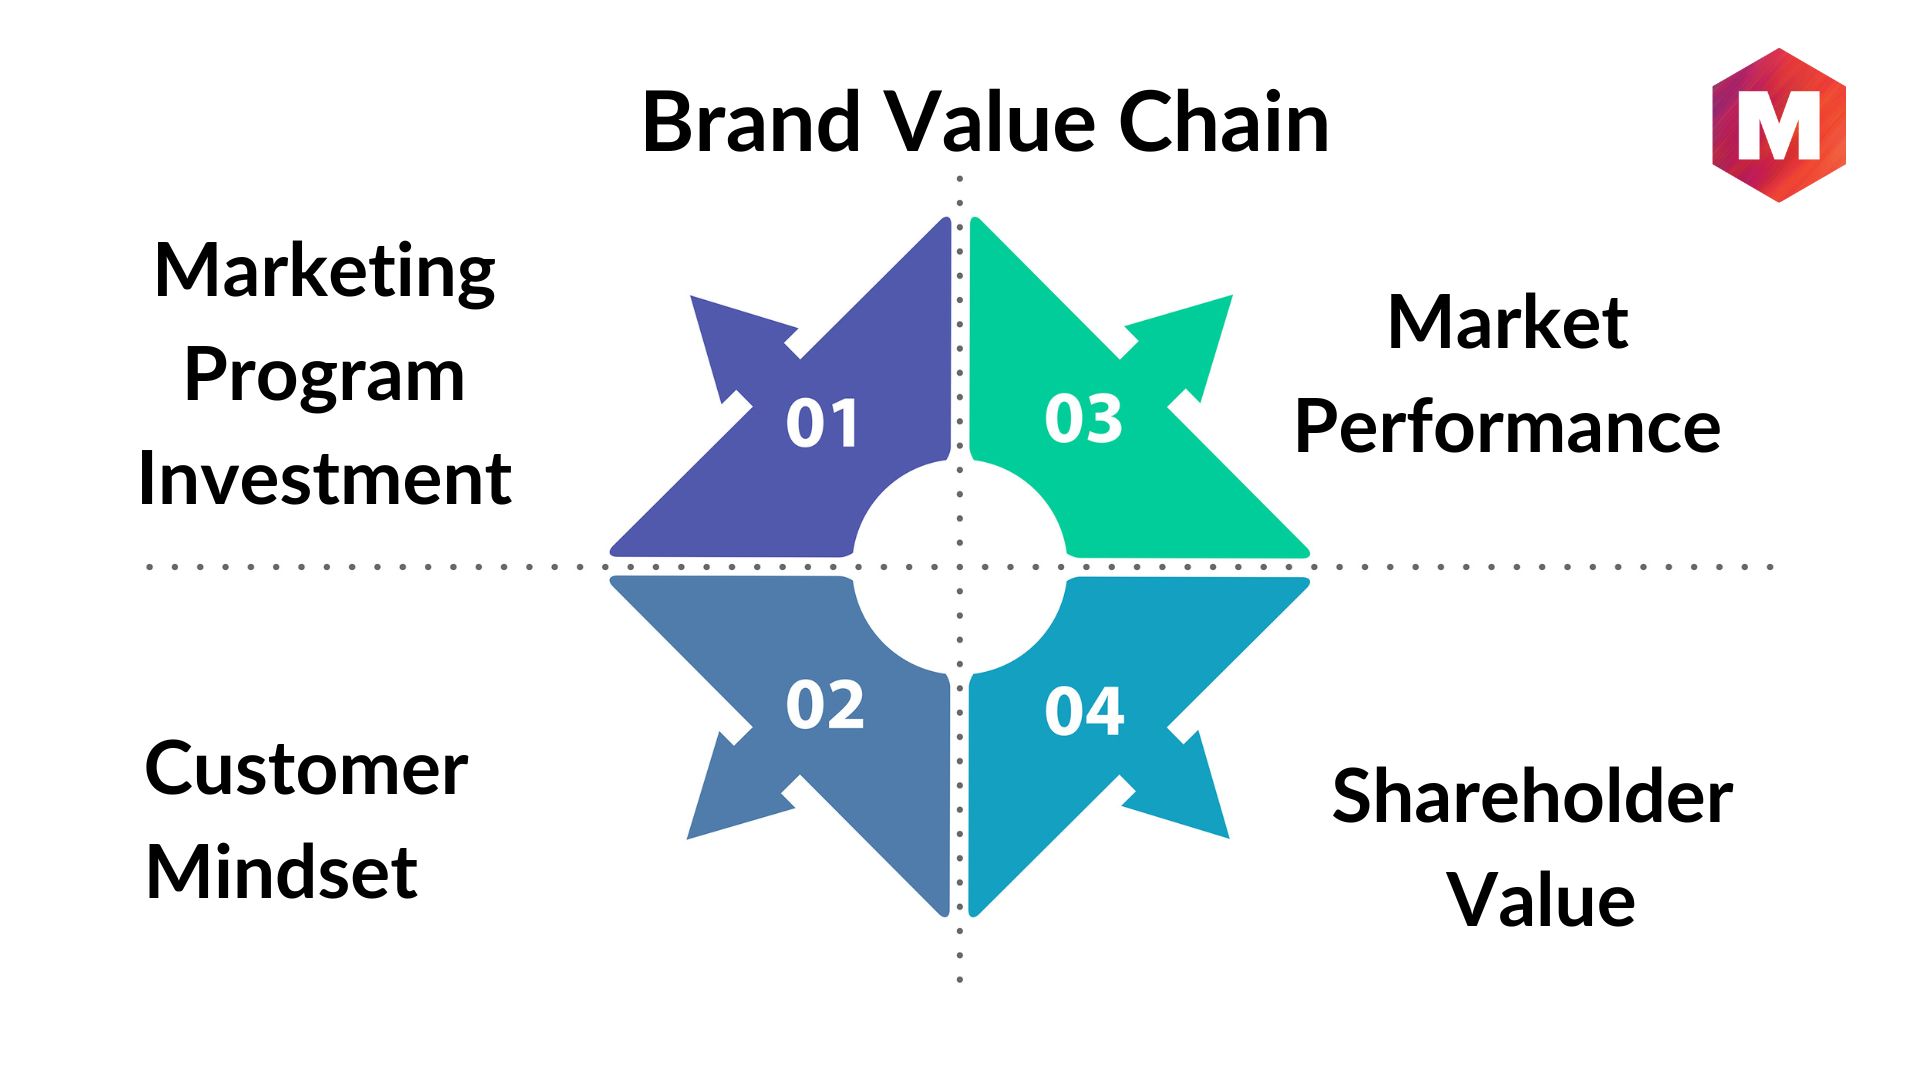
What is a Brand Value Chain? A brand value chain is a framework that helps businesses understand how value is created, delivered, and captured within…
The 12 Brand Archetypes Explained with Examples
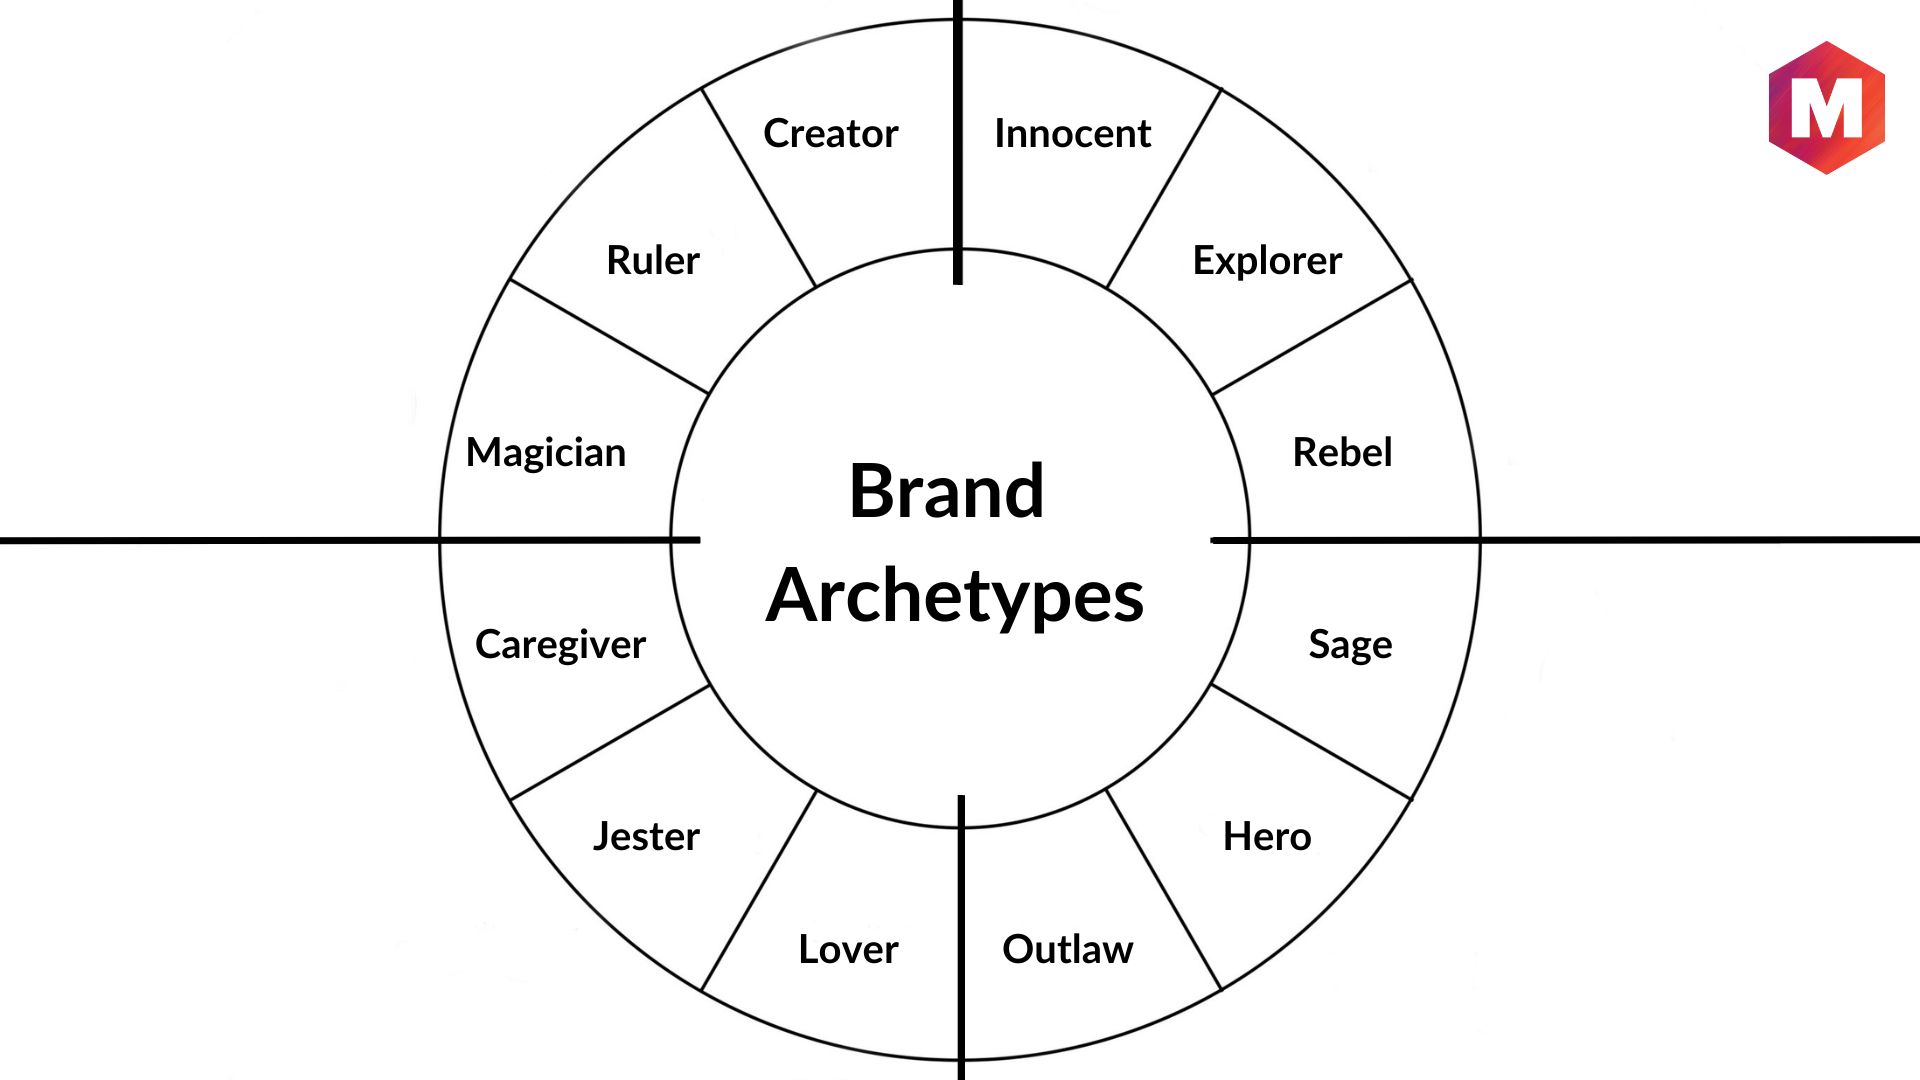
What are brand archetypes? Brand archetypes are universal symbols or characters that help create a brand identity and convey brand values as a persona. By…
What is a Brand Bible and How to Build One?

What is a Brand Bible? A Brand Bible is the definitive source for a company’s brand design, treatments, and fundamentals. Brand bibles are essential to…
Individual Branding: Definition, Examples, Strategies & Tips

What is Individual Branding? Individual Branding is the process of creating, developing, and promoting a brand identity that is uniquely associated with an individual product…
Brand Knowledge: Definition, Examples, Elements and Importance
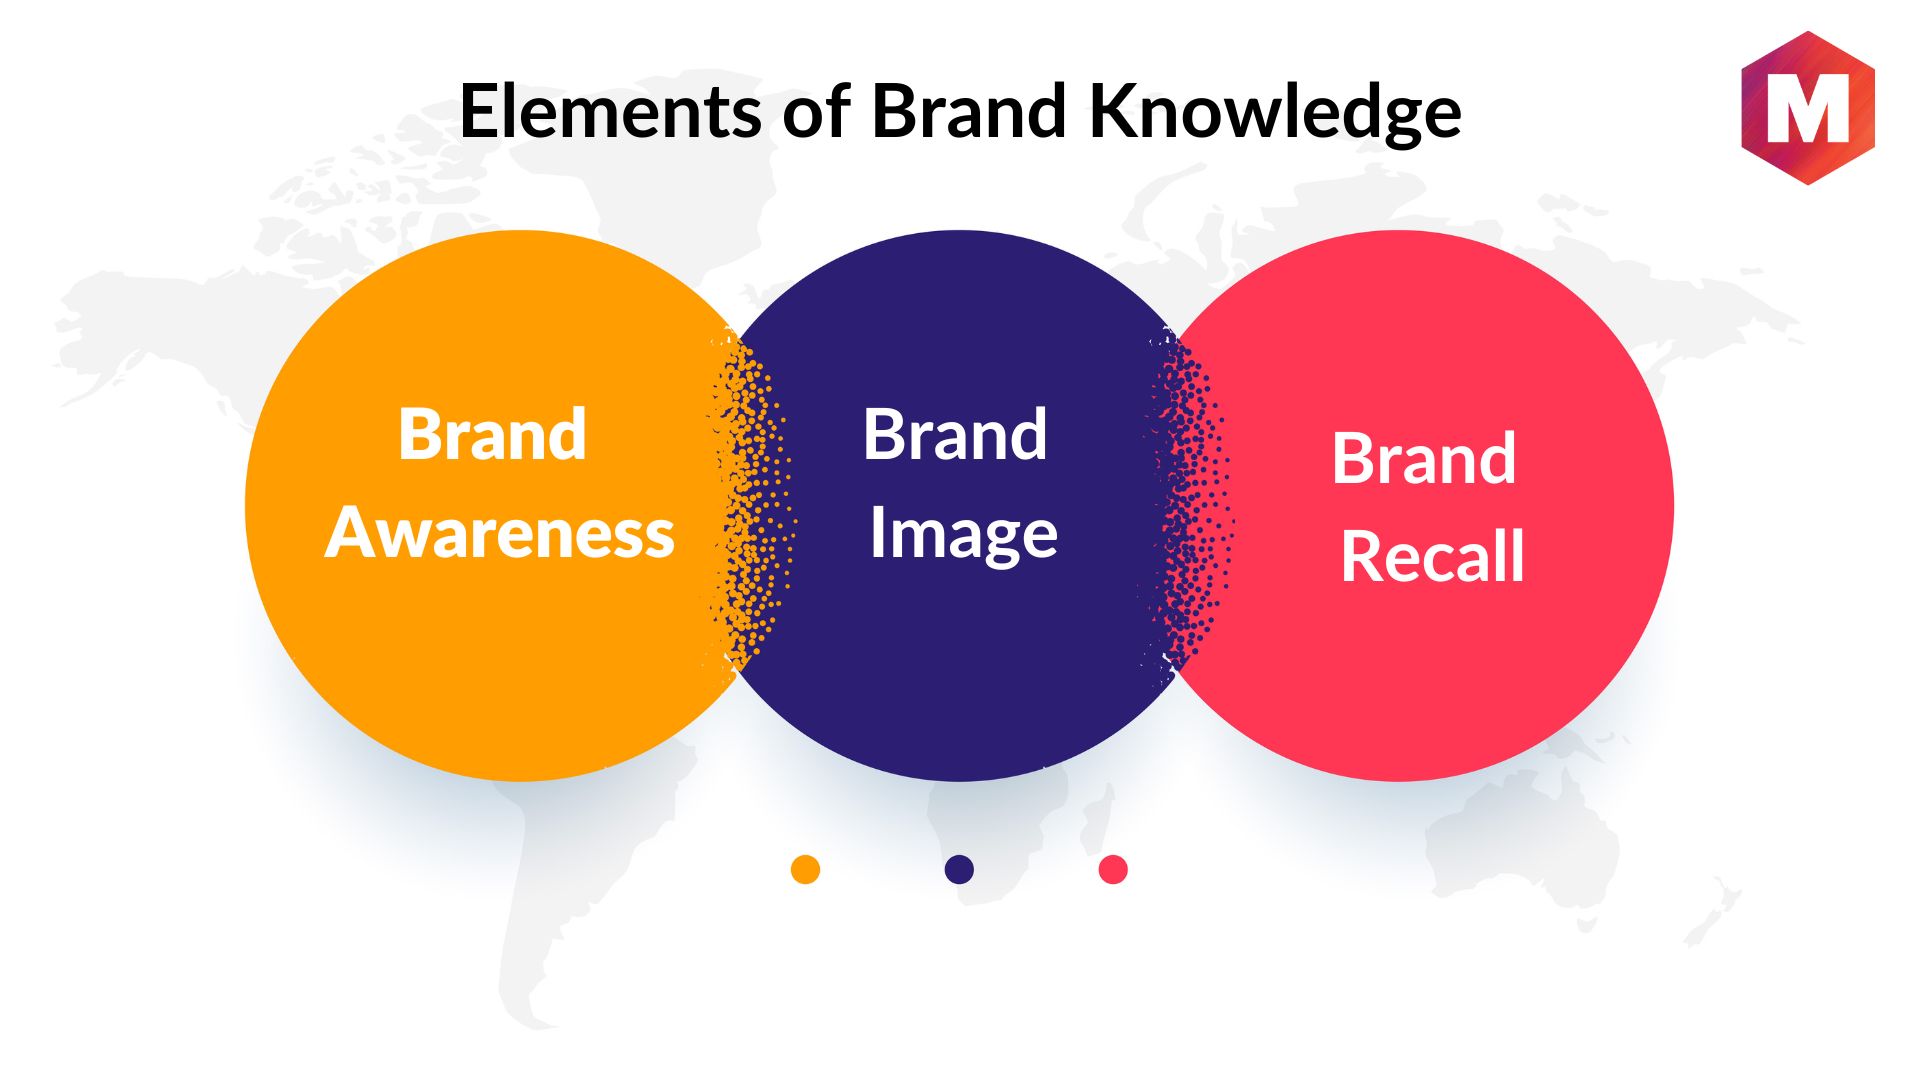
What is Brand Knowledge? Brand knowledge is recognizing and understanding the features, benefits, and value of a brand’s products or services. Branding helps customers form…
Warehousing: Definition, Types, Process and Functions
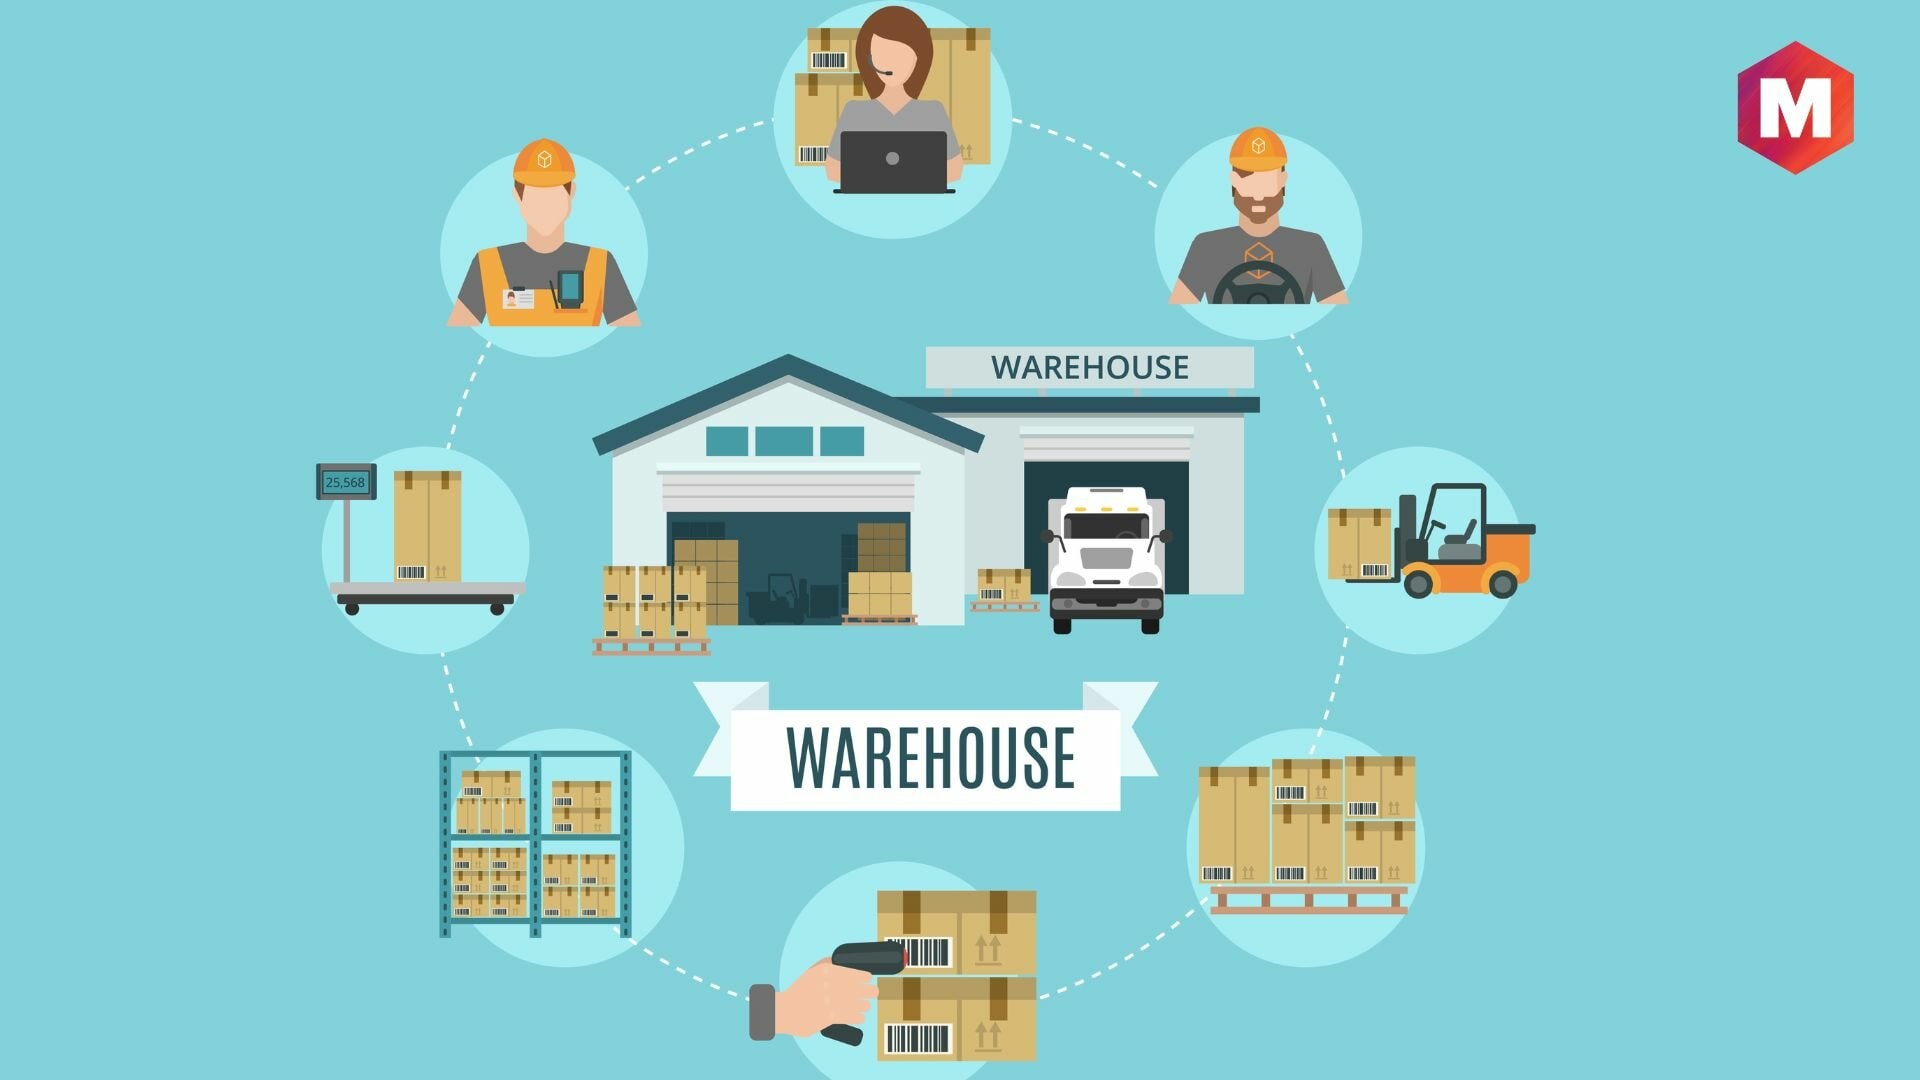
Warehousing is a crucial part of the supply chain process that provides a storage facility. Warehouses are used to store goods and materials, improve the…
Retail Industry: Overview, Trends, Activities and Challenges

The retail industry refers to all those businesses that engage in the sale of goods and services to customers. It includes various types of stores…
What Is Inventory Management? Benefits, Challenges and Tips

Inventory management is an important part of every business’s operations. It helps expand a business’s capacity for growth and profitability, as well as provides a…
What is Actual Product? Definition, Examples and Importance
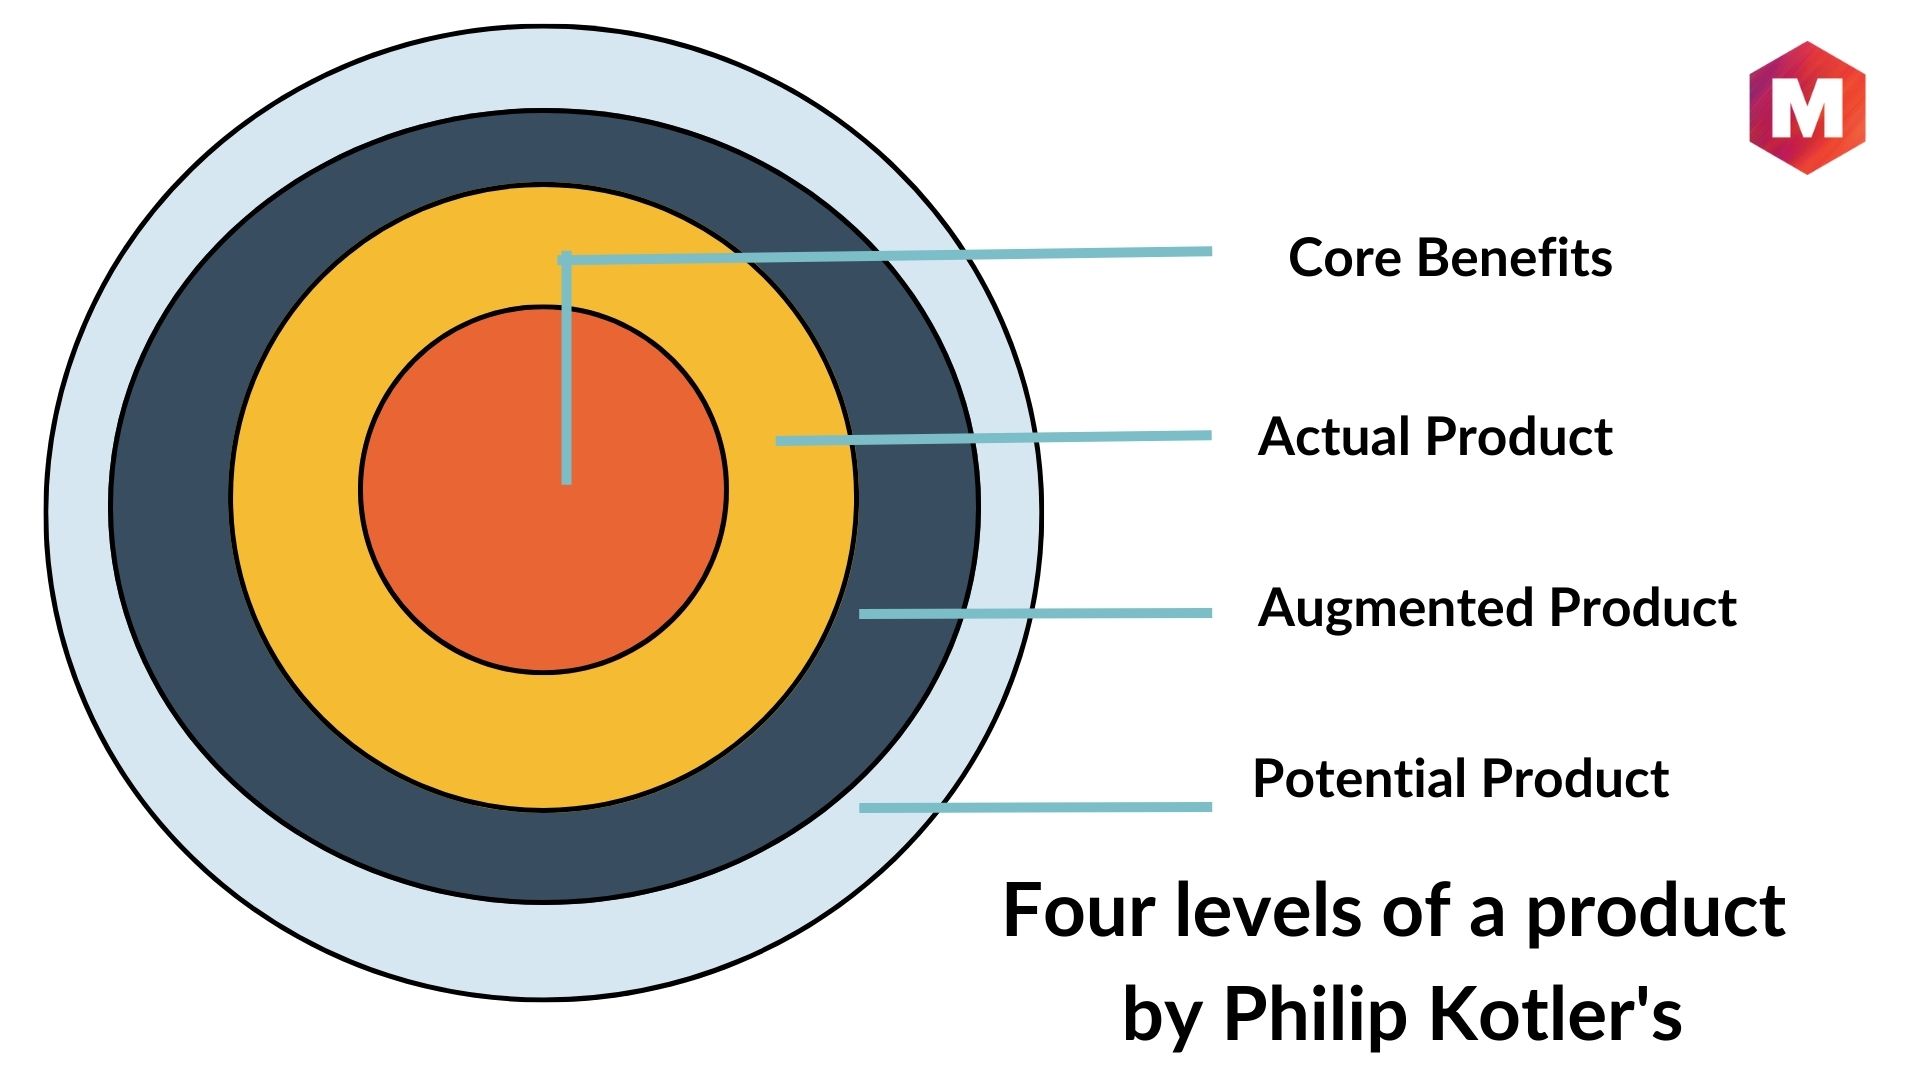
What is Actual Product? An actual product is a tangible product that a consumer purchases in order to obtain the core benefits that the product…
Characteristics of Retailing

What is Retail? Retail refers to the activities and processes involved in selling goods or services directly to consumers for their use. Retail stores, also…
Competitive Environment – Definition, Types, Factors and Examples

What is a competitive environment? A competitive environment is the market space within which companies compete to gain market share. It includes all the elements…