
We live in a hyper-connected world with consumers becoming more discerning than ever. They yearn for authenticity and a genuine relationship with brands that reflect…
Marketing Category
The Marketing category has detailed articles, concepts and How-tos to help students and professionals learn the concepts and applications.
Social Proof: Definition, Importance, Types and Examples
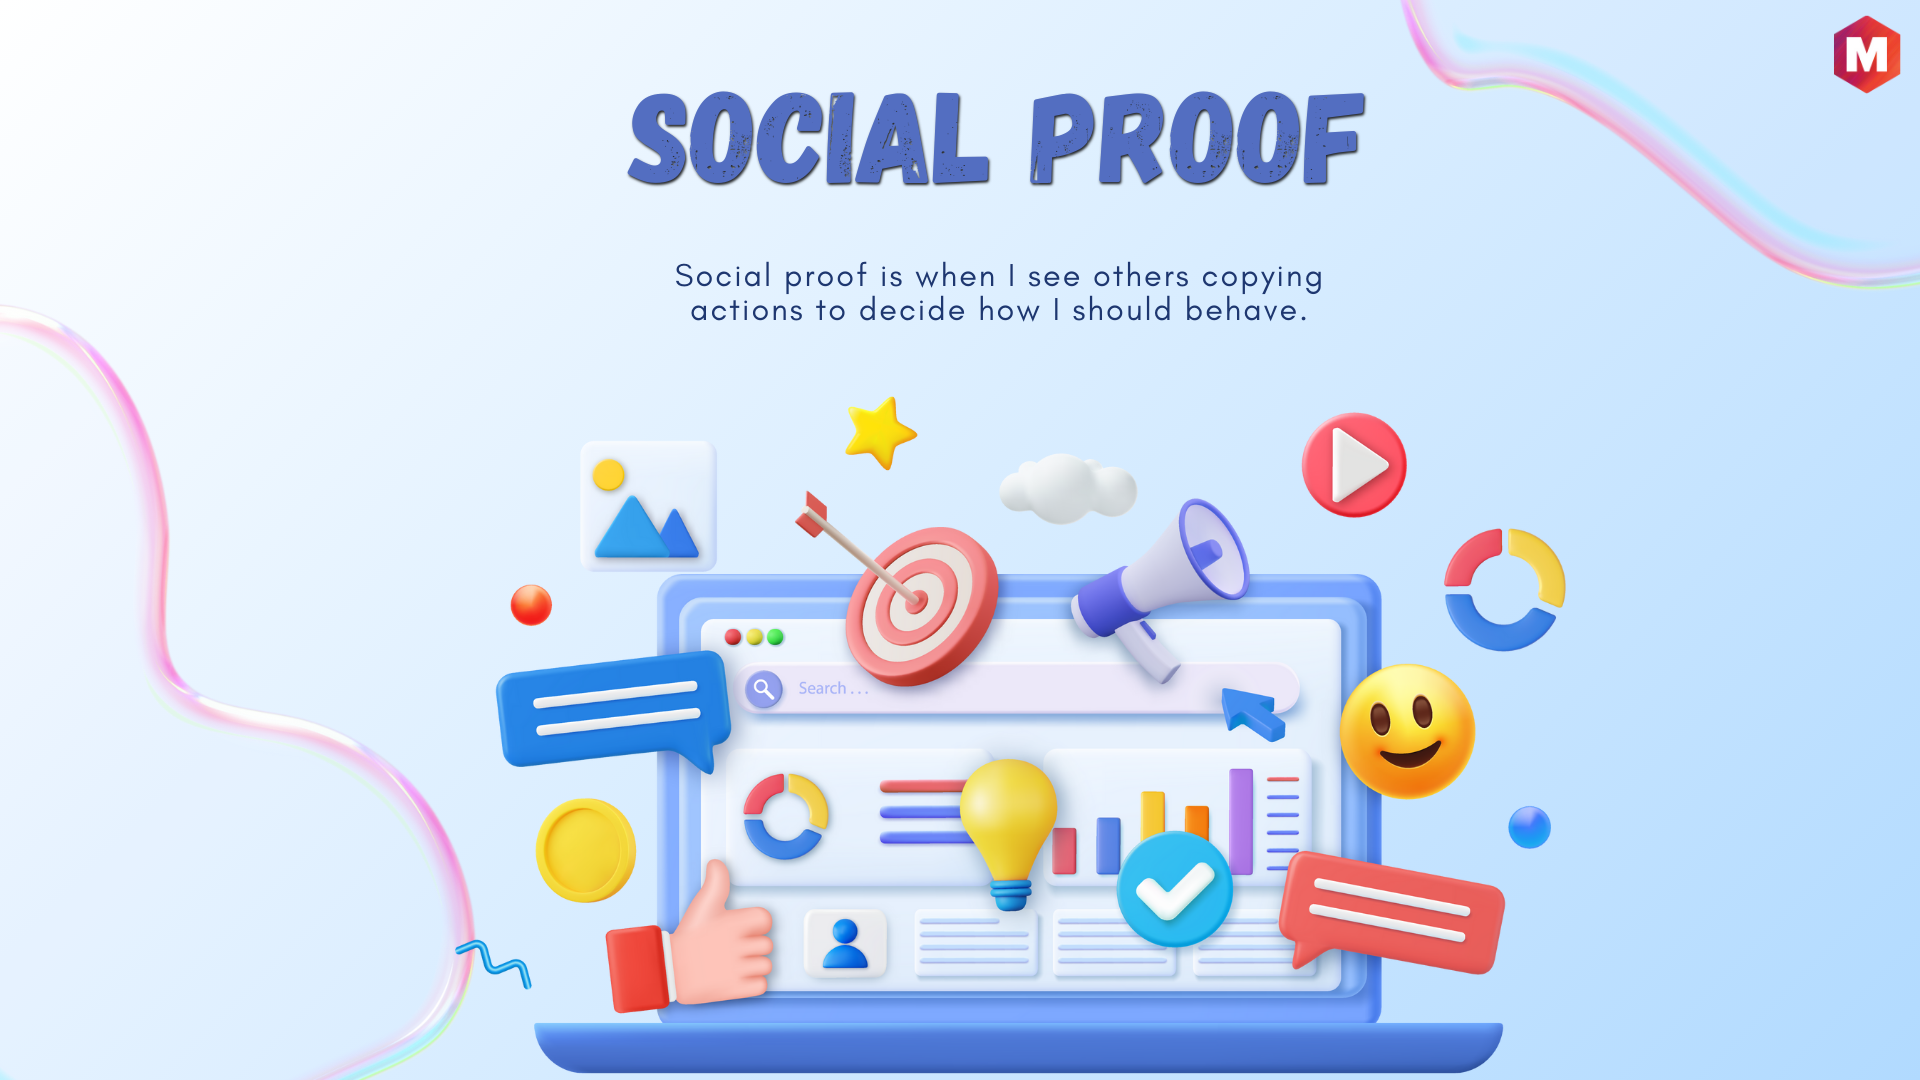
Social proof in Marketing is when people copy actions of others and behave accordingly. This may happen because you assume that others know better, especially…
What is Consumer Marketing? Definition, Strategies & Example
Definition Consumer marketing is about knowing what drives individuals to buy a product and then devising techniques that appeal to their emotions. It is a…
After-Marketing: Definition, Importance & Examples

What is After-Marketing? After-marketing, often called post-sales marketing, is a strategy focused on providing continuous support and value to a customer who has already made…
Advertising Weight: Definition, Importance & Examples

What is Advertising Weight? Advertising Weight refers to the measure of exposure that a particular ad campaign garners, individually or within a pool of campaigns….
Advertising Research: Definition & How to do it?

What is Advertising Research? Advertising Research is a specialized form of marketing research conducted to improve the efficacy of advertising. It involves a systematic process…
Advertising Plan: Definition, Examples & Steps

What is An Advertising Plan? An advertising plan is a comprehensive blueprint that outlines an organization’s advertising efforts. It lays out the key marketing strategies,…
What is 360 Degree Branding? Definition & Examples

What is 360 Degree Branding? 360 Degree Branding refers to a holistic marketing strategy that ensures a brand’s identity is represented consistently across all marketing…
Advertising Elasticity of Demand (AED): Definition & Examples
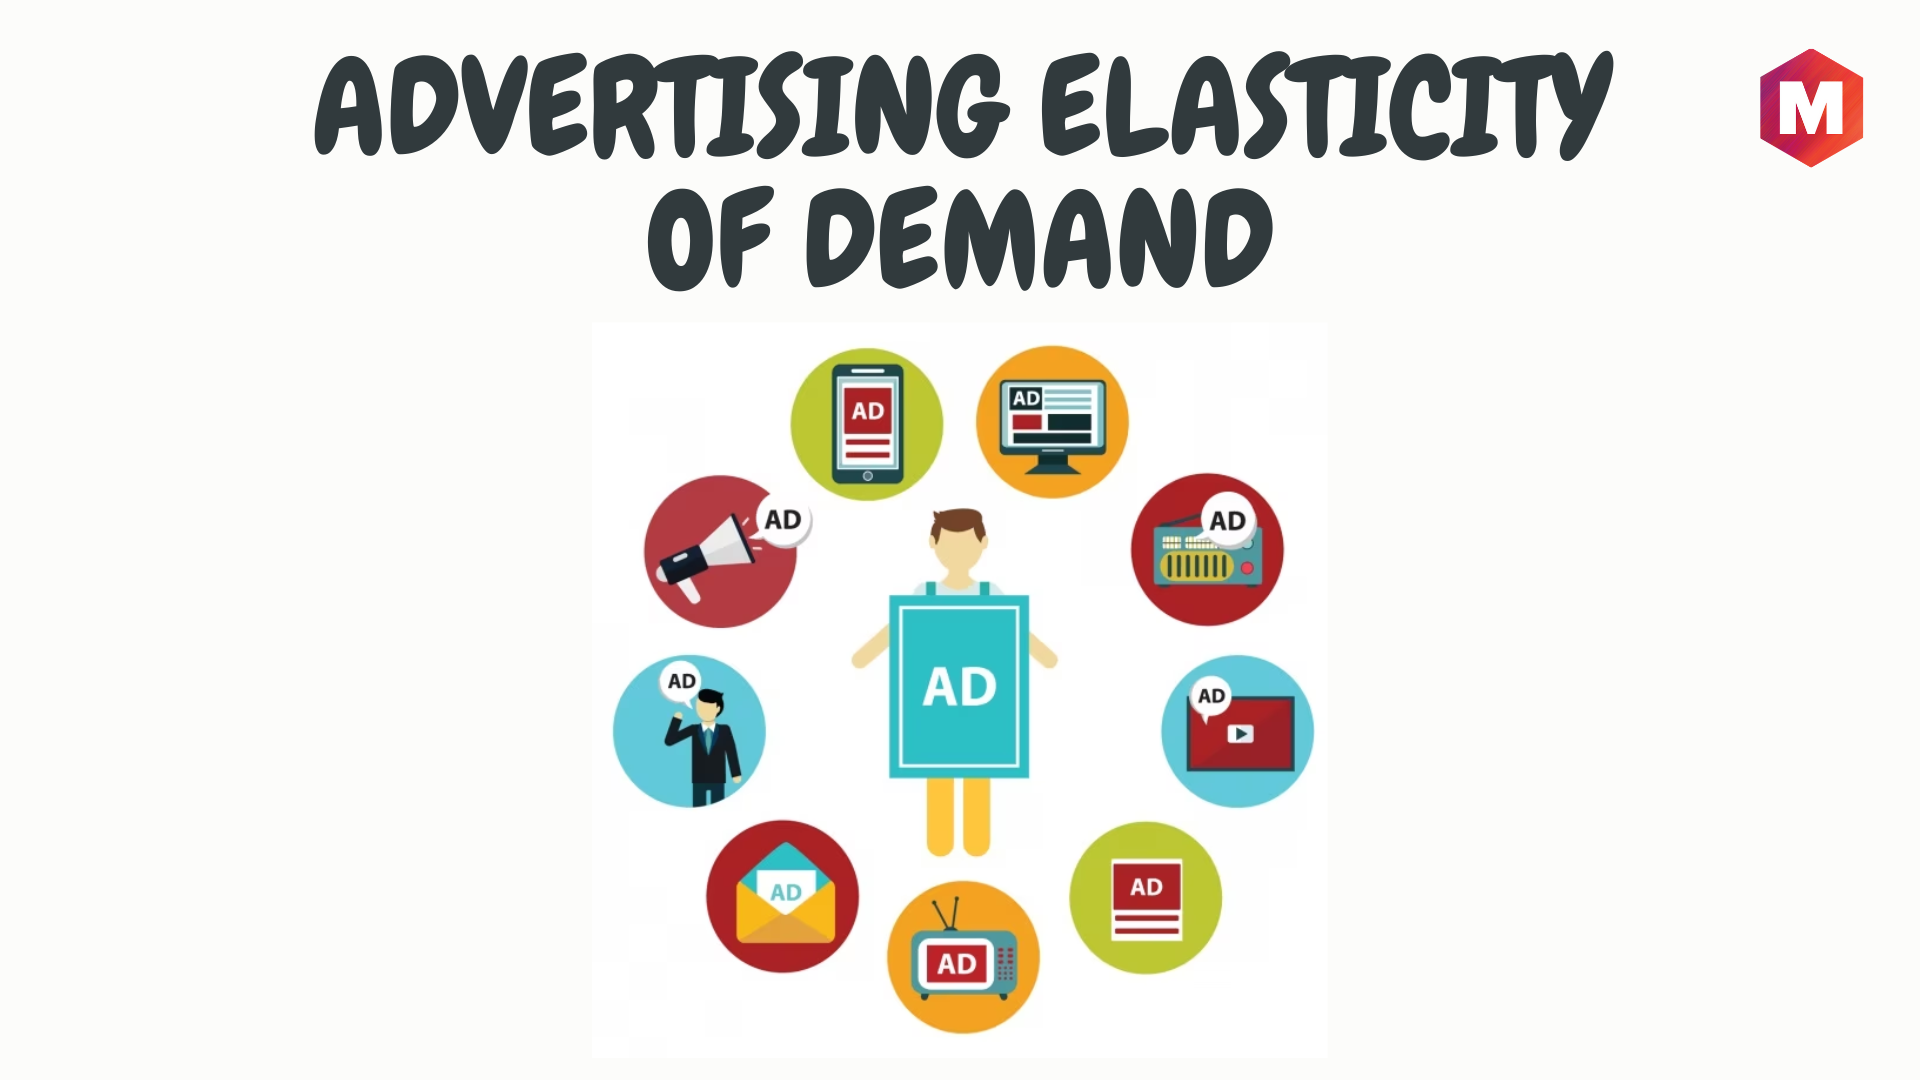
What Is Advertising Elasticity of Demand? Advertising Elasticity of Demand (AED) is essentially a yardstick that allows us to measure the potency of a rise…
Advertising Coverage: Definition, Importance, Types & Examples

What is Advertising Coverage? Advertising coverage is a measure of the extent to which your marketing message reaches your intended audience. It’s all about how…
Advertising Copy: Definition, Types & Tips
What is an Advertising Copy? Advertising copy refers to the branded content in advertisements that aim to persuade the target audience to take a specific…
Advertising Budget: Definition, Examples & Strategies

What is an Advertising Budget? An advertising budget is the amount of money a company allocates for promotions and advertisements over a specific period. This…
Additional Mark-On: Definition, Meaning & Examples
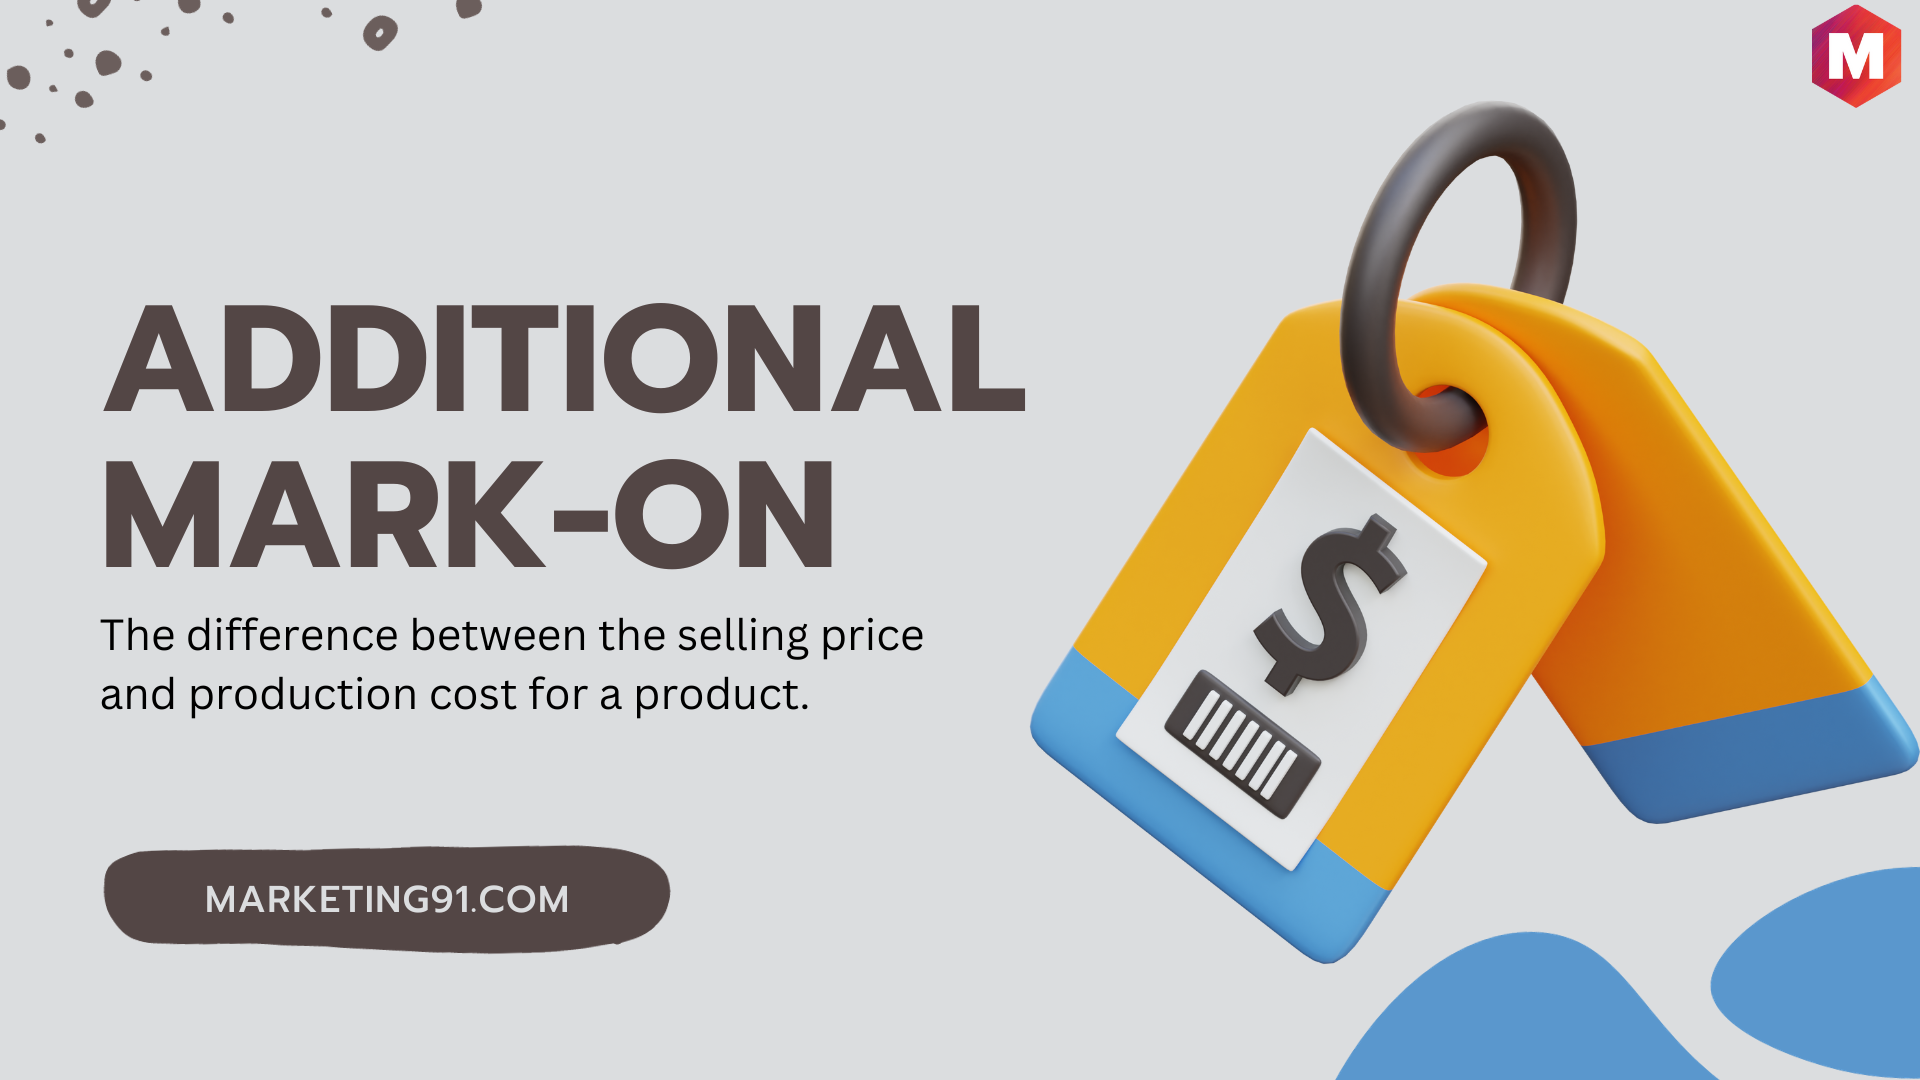
What is Additional Mark On? Additional Mark-On is the difference between the selling price and production cost for a product. This is also known as…
Add-On Sales: Definition, Examples & Techniques
What are Add-On Sales? An Add-On Sale refers to the strategy of selling additional products or services to a customer who has already decided to…
Advertising Channels: Definition, Types and Importance

What is an Advertising Channel? An advertising channel is a medium that businesses use to advertise their products and services to their target audience. They…
Active vs Passive Marketing: Key Differences
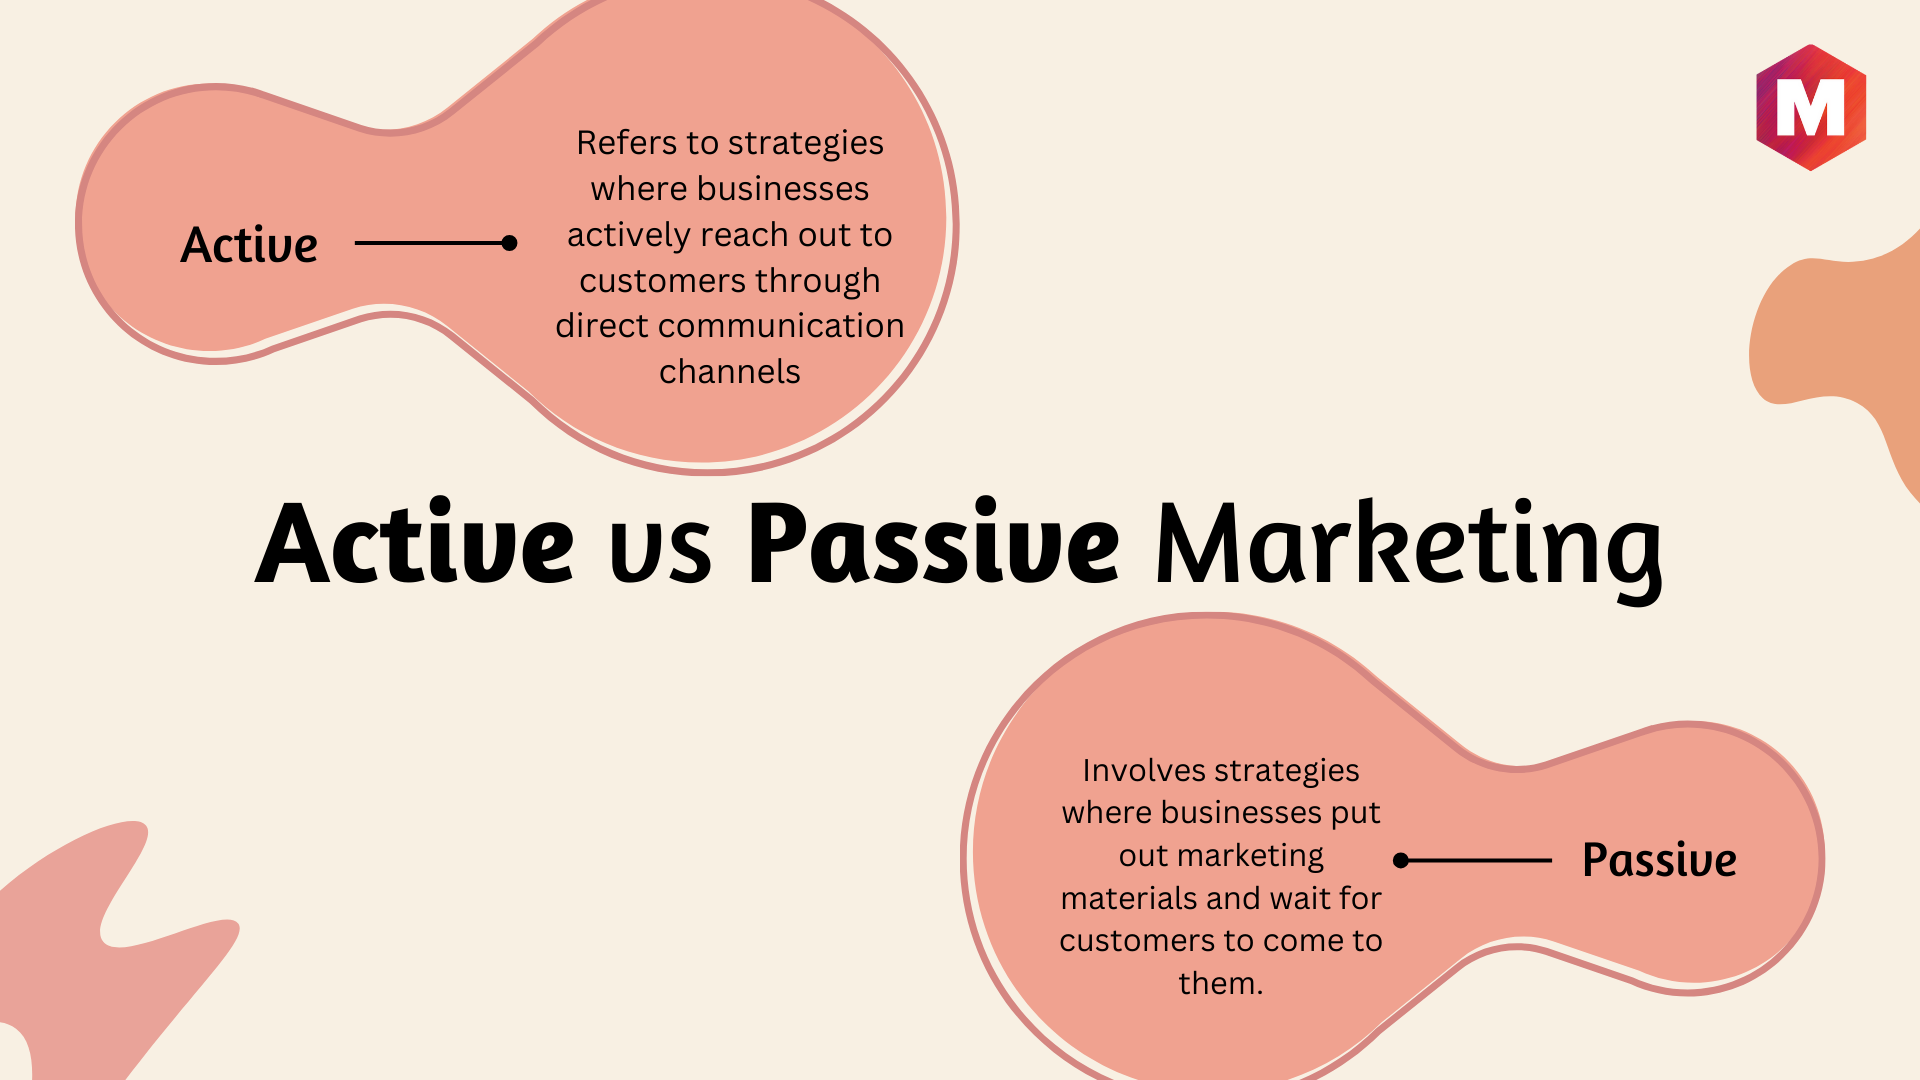
What is Active and Passive Marketing? Active marketing refers to tactics in which organizations actively engage with clients via direct communication channels. On the other…
Active Customers: Definition, Meaning and Types

What are Active Customers? Active customers refer to individuals who have interacted with a business’s products, services, or platforms within a specific timeframe. This interaction…
The 40 40 20 Rule of Direct Mail Marketing
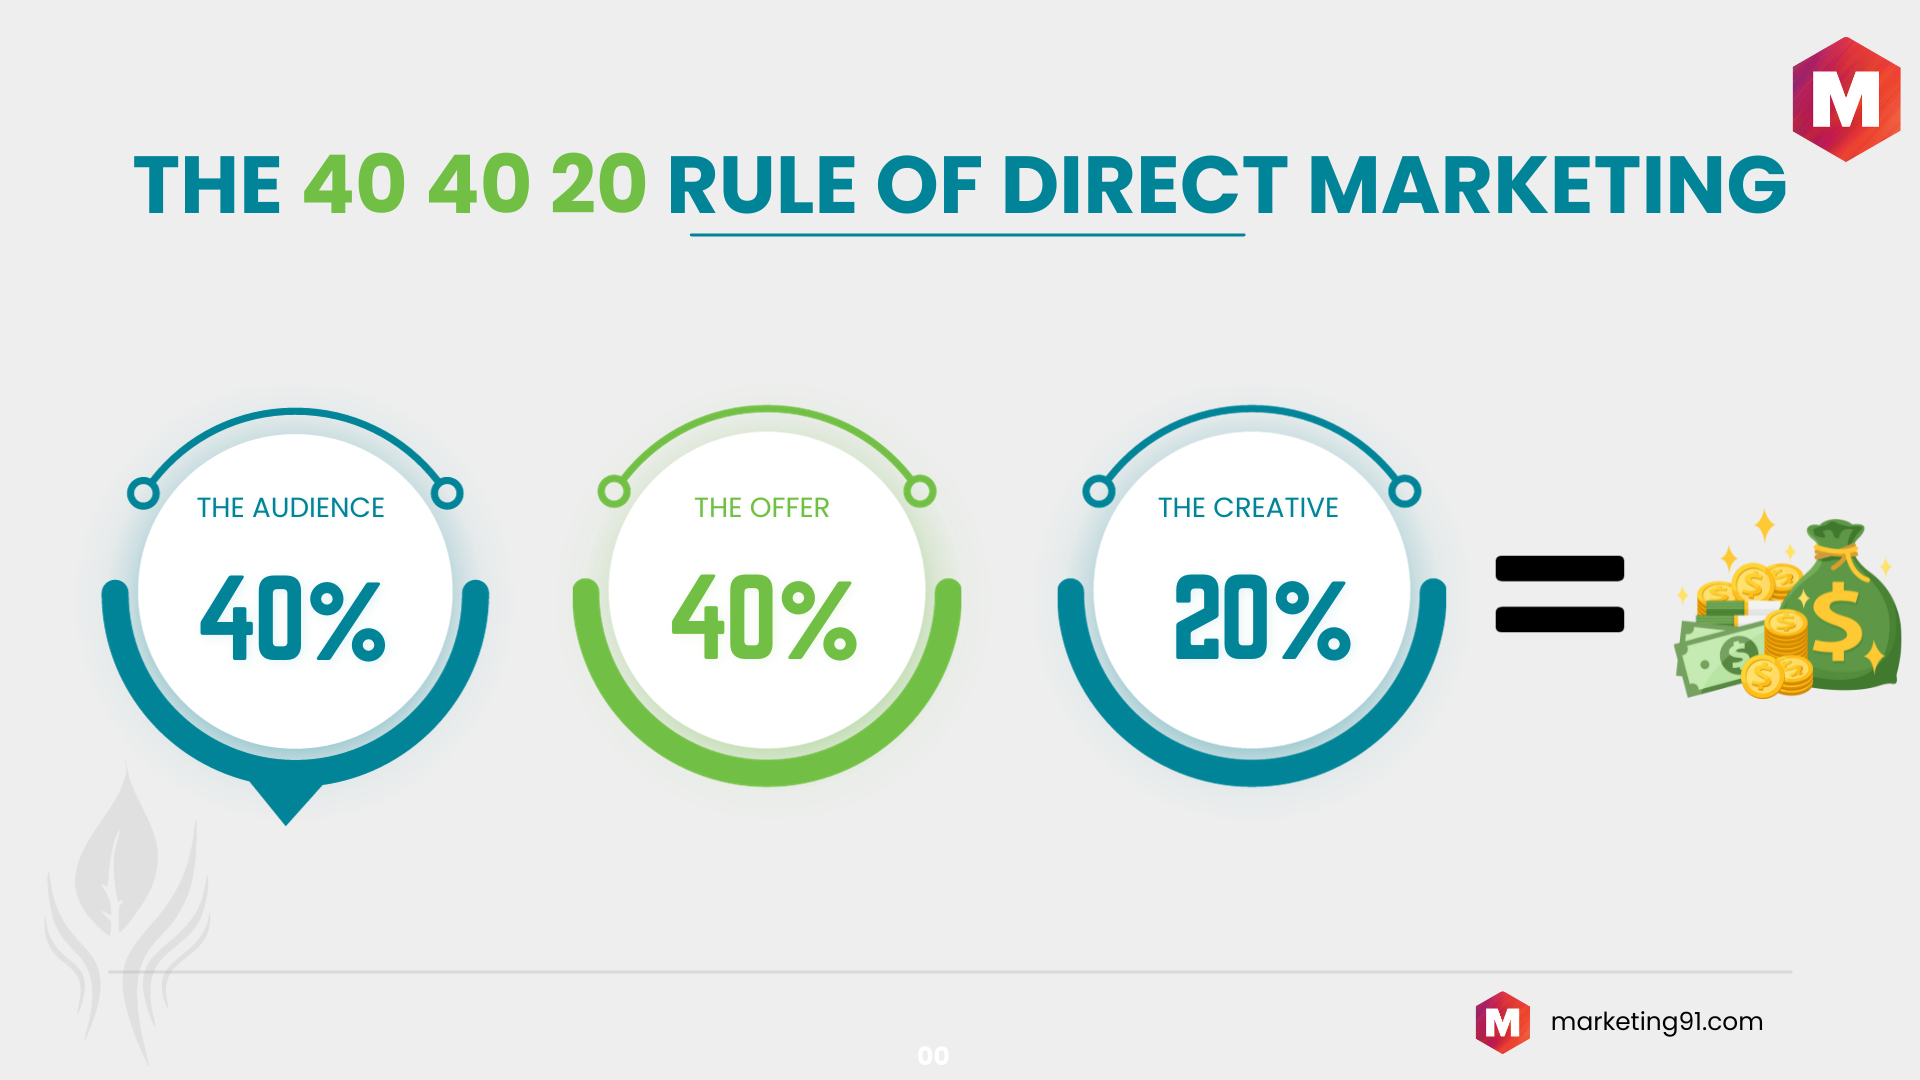
What is 40 40 20 Rule of Direct Mail Marketing? The 40 40 20 rule is an established principle in direct mail marketing that proposes…
What are the 4 R’s of Marketing?
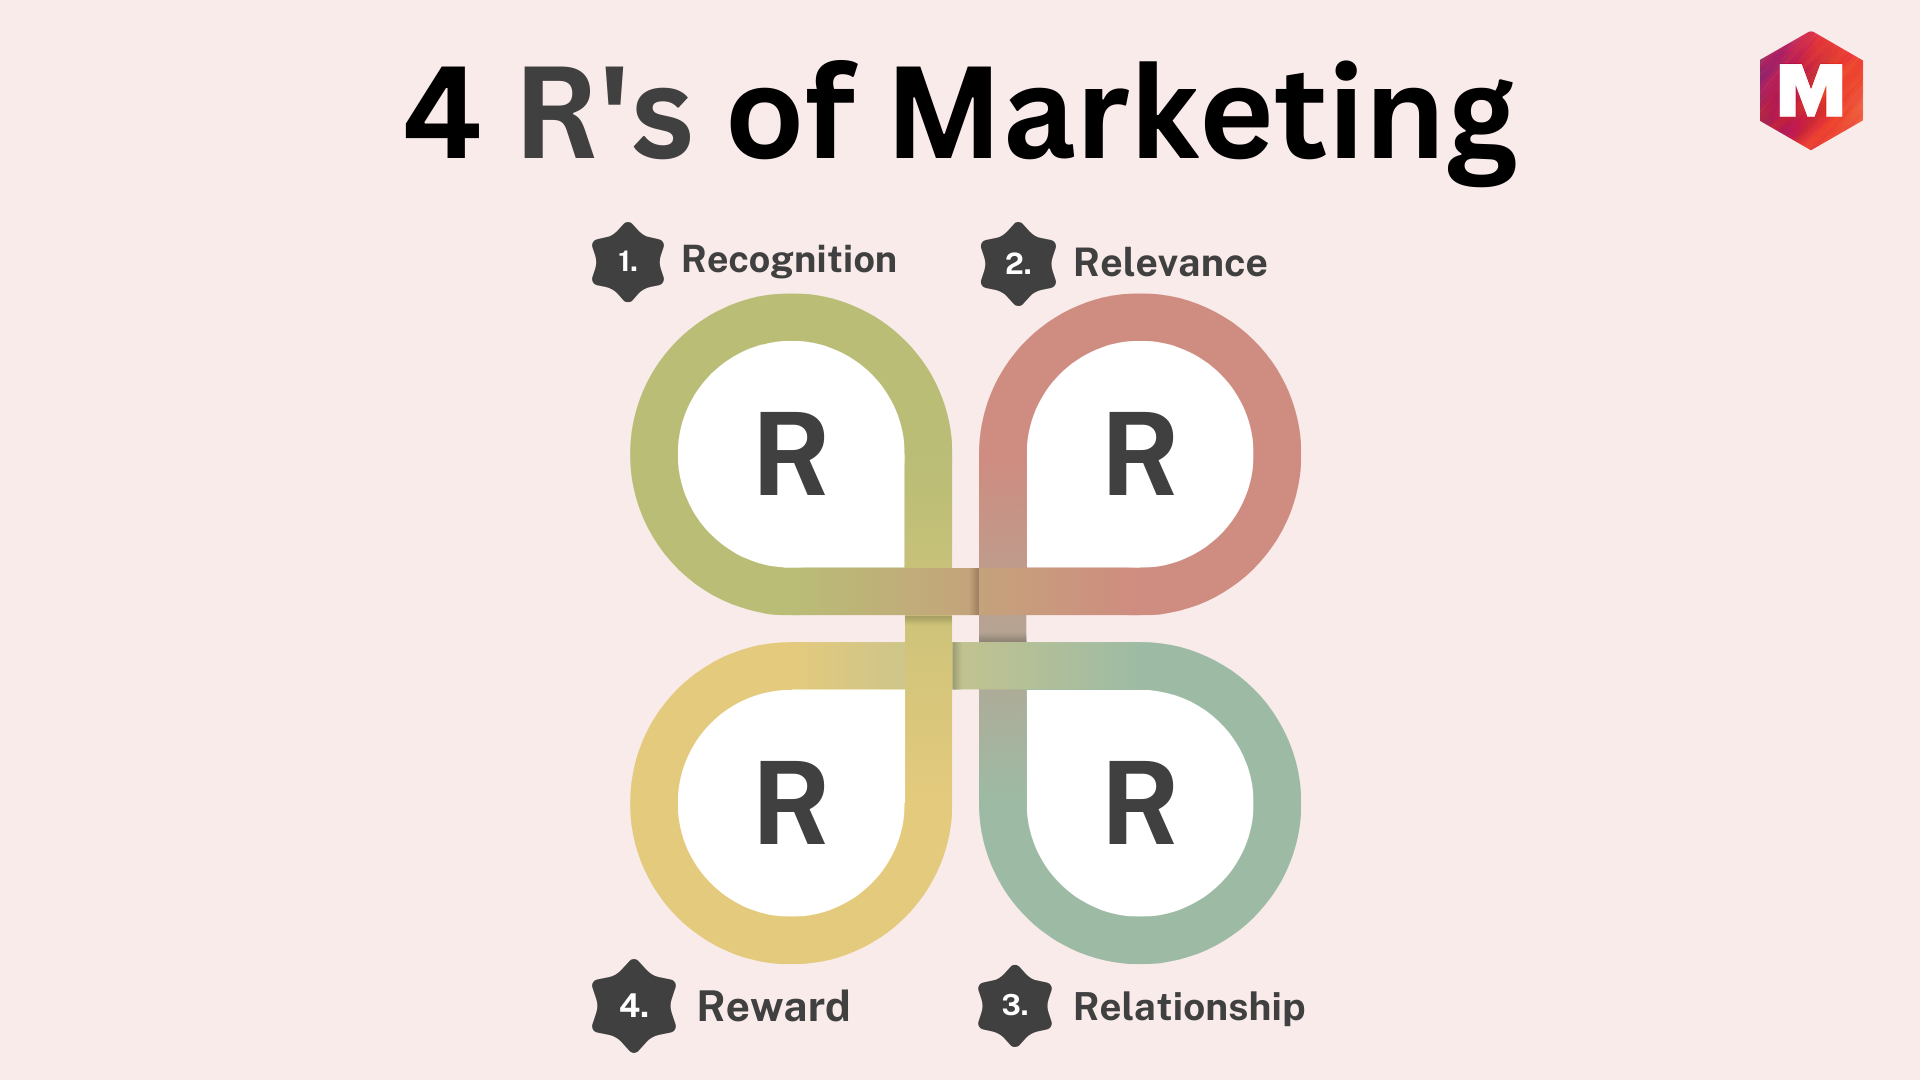
When it comes to successful marketing efforts, there are four key components that play a crucial role in achieving success. These are commonly known as…
Captive Audience: Definition, Importance & Examples
In an age of endless media consumption, the concept of a captive audience has taken on a new significance. The ability to command the undivided…
Consignment Sales: Definition, Advantages and Disadvantages

A consignment sale is a business transaction in which one person (the consignor) gives objects to another person (the consignee) for selling purposes. The consignee,…
Brand Journalism: Definition, Importance and Examples

What is Brand Journalism? Brand Journalism refers to a type of marketing that focuses on creating content that looks, feels, and reads like traditional journalism….
Oligopoly: Definition, Characteristics, Types and Examples
The characteristics of an oligopolistic market structure include interdependent decisions, a kinked demand curve, and competitive behavior among firms. Interdependence means that each firm takes…
Brand Differentiation: Definition, Examples, Steps and Importance (Updated 2025)

What is Brand Differentiation? Brand differentiation creates a brand identity that sets the brand apart from competitors. Brand differentiation helps brands charge premium prices and…
Book-To-Bill Ratio: Definition, Examples and Calculation

What is Book-To-Bill Ratio? Book to bill ratio is the ratio of orders received to the orders shipped to measure the demand and supply gap…
Perishability | Definition, Importance and Uses in Industries
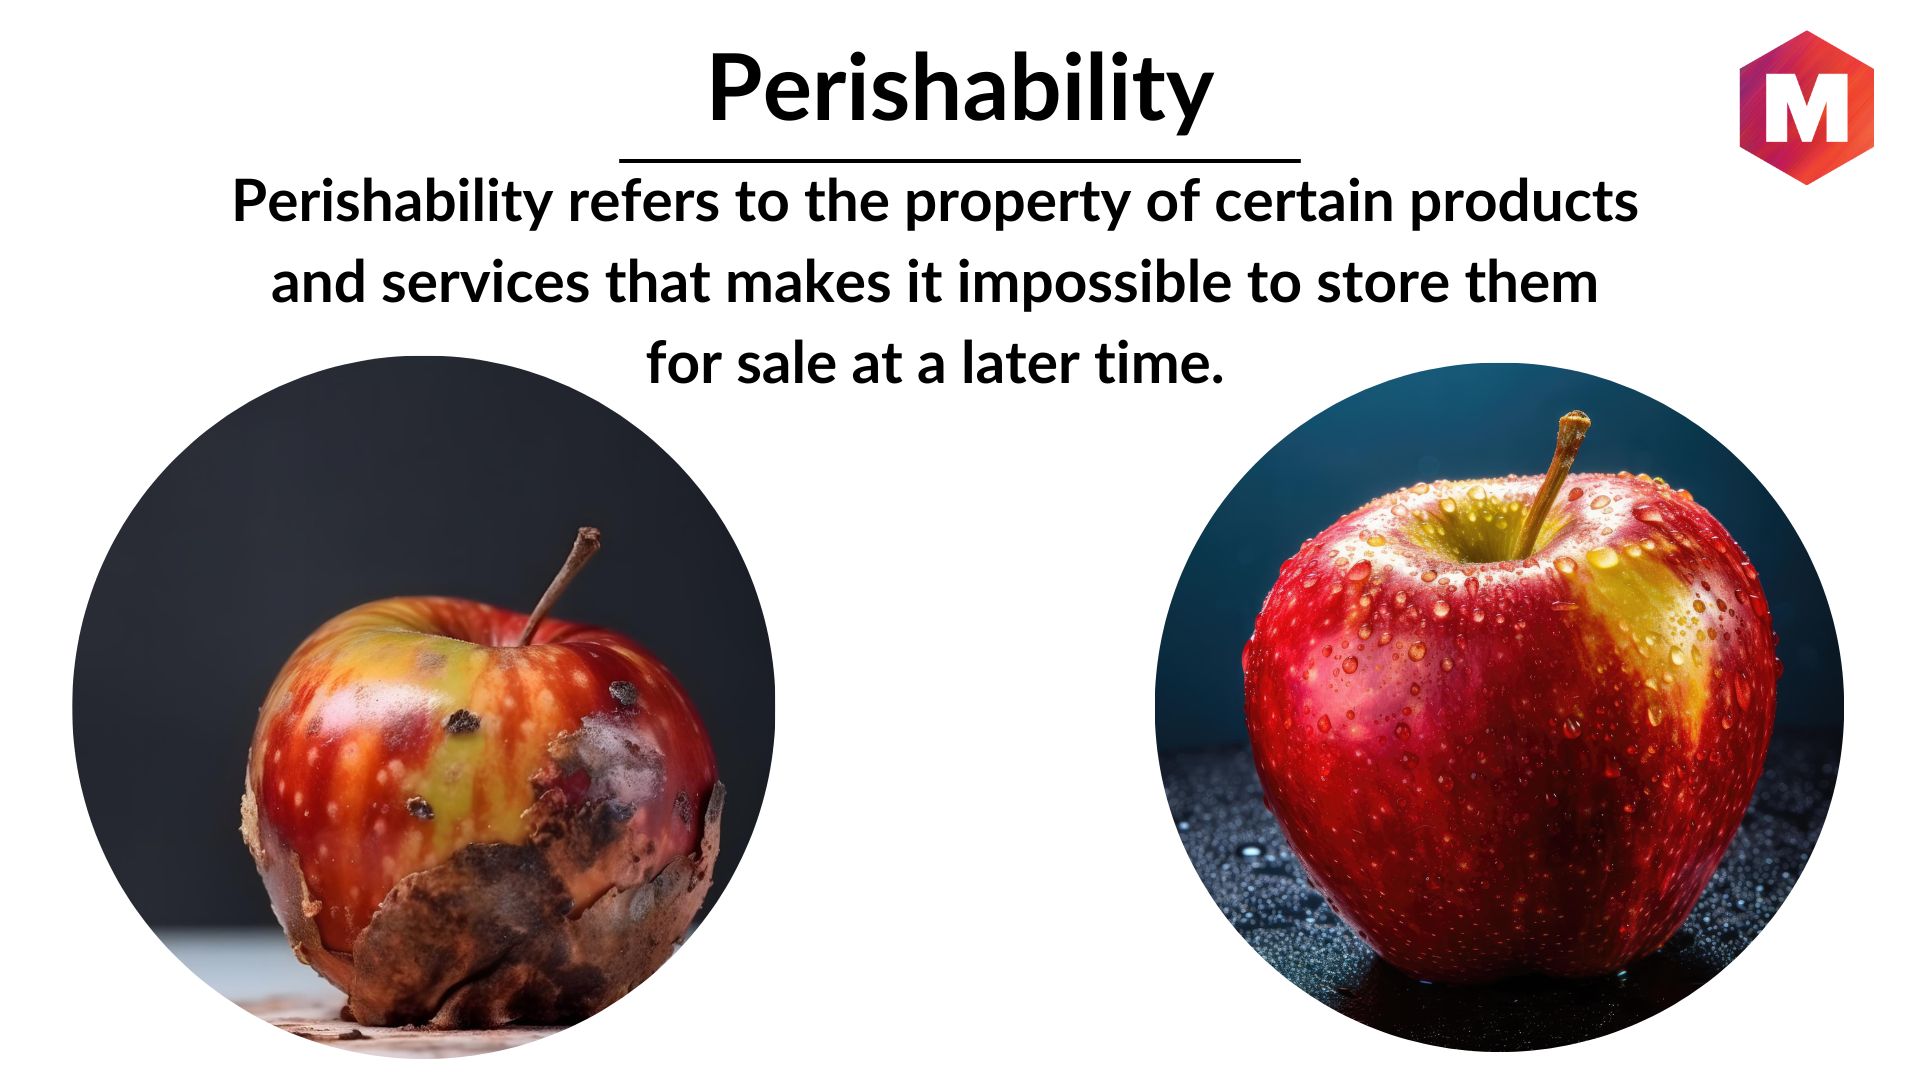
Perishability refers to the property of certain products and services that makes it impossible to store them for sale at a later time. This means…
Top 10 Largest United States Companies in 2025

In this article, we discuss the largest companies in the United States in 2023. We have done extensive research to get the revenue and Market…
The Five Brand Pillars: Examples and How to Build one?
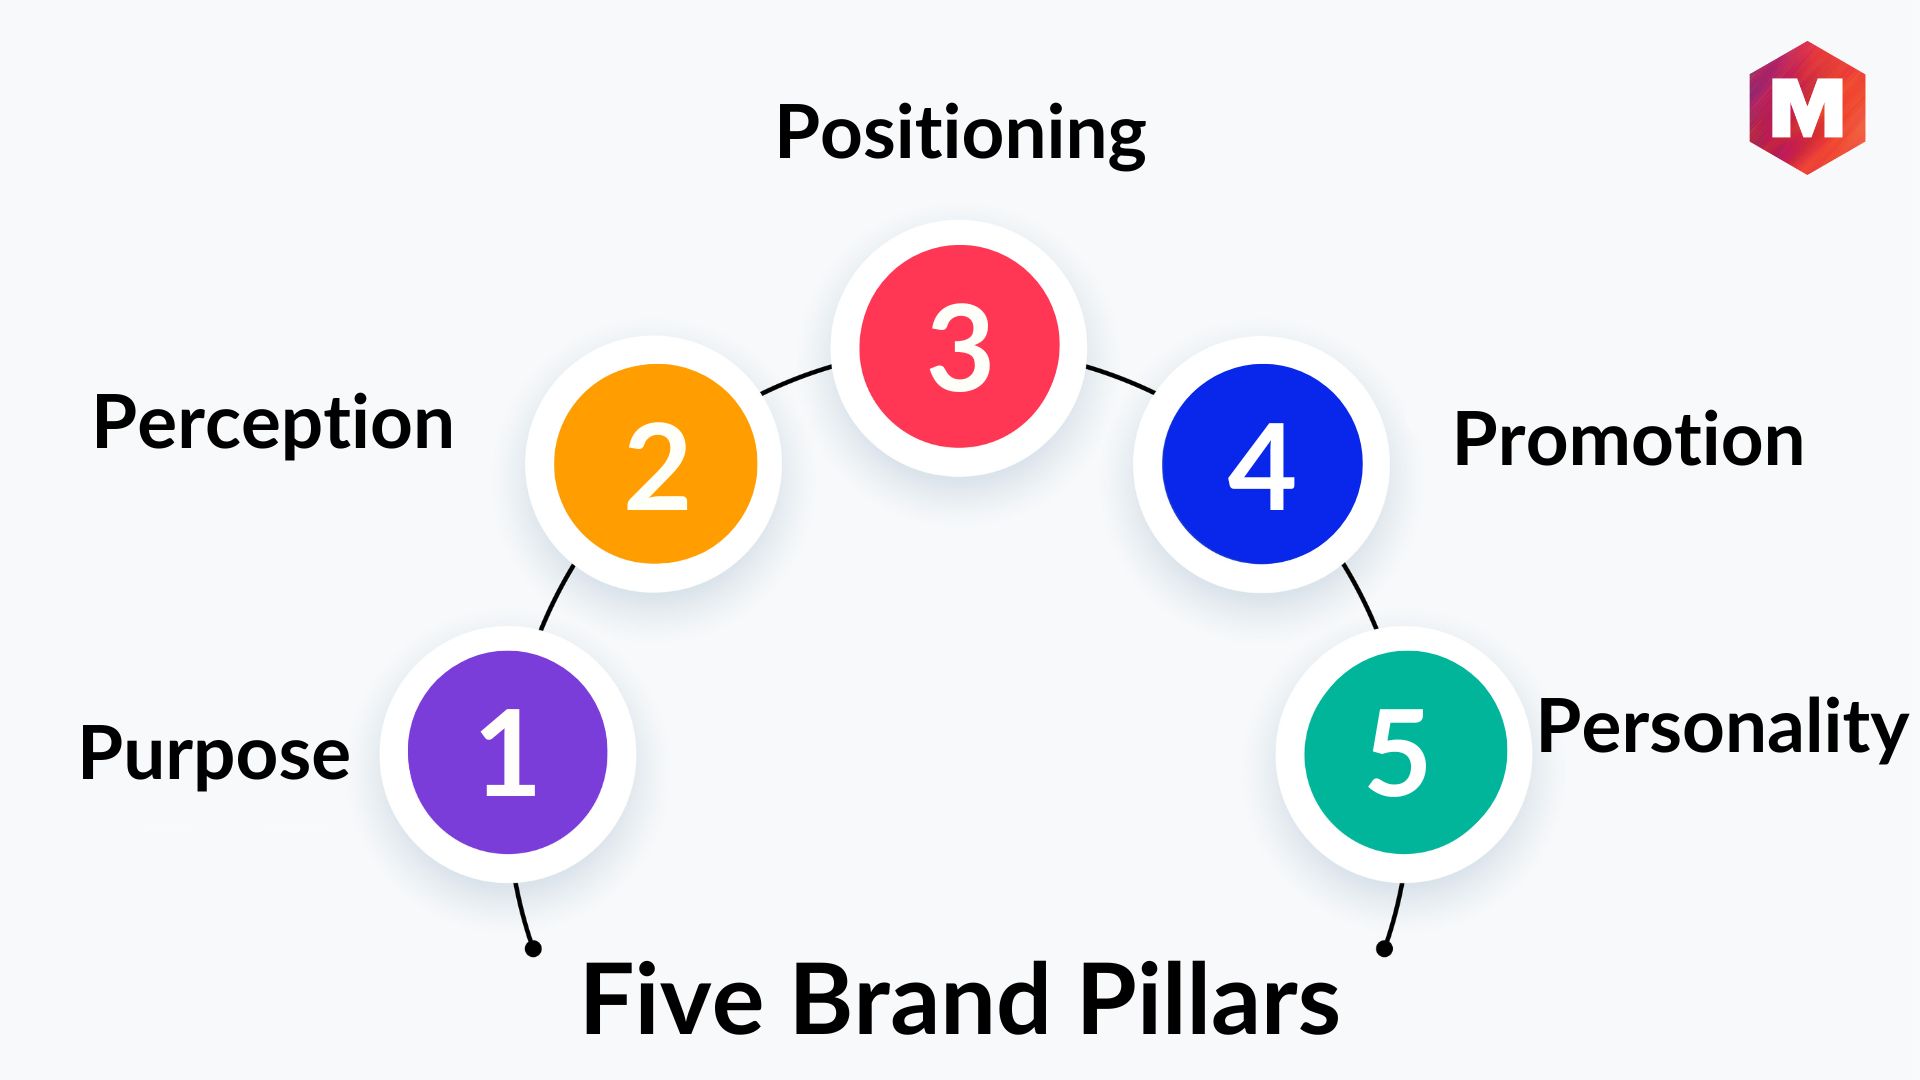
What are Brand Pillars? Brand pillars are the core values that guide and inform a brand’s identity. They provide a foundation for all of the…
Leveraging Secondary Brand Associations to Build Brand Equity

Leveraging secondary brand associations is a way of associating with another entity or brand to help you build brand equity, expand into new markets, and…
Brand Mascots: Definition, Benefits, Tips and Examples
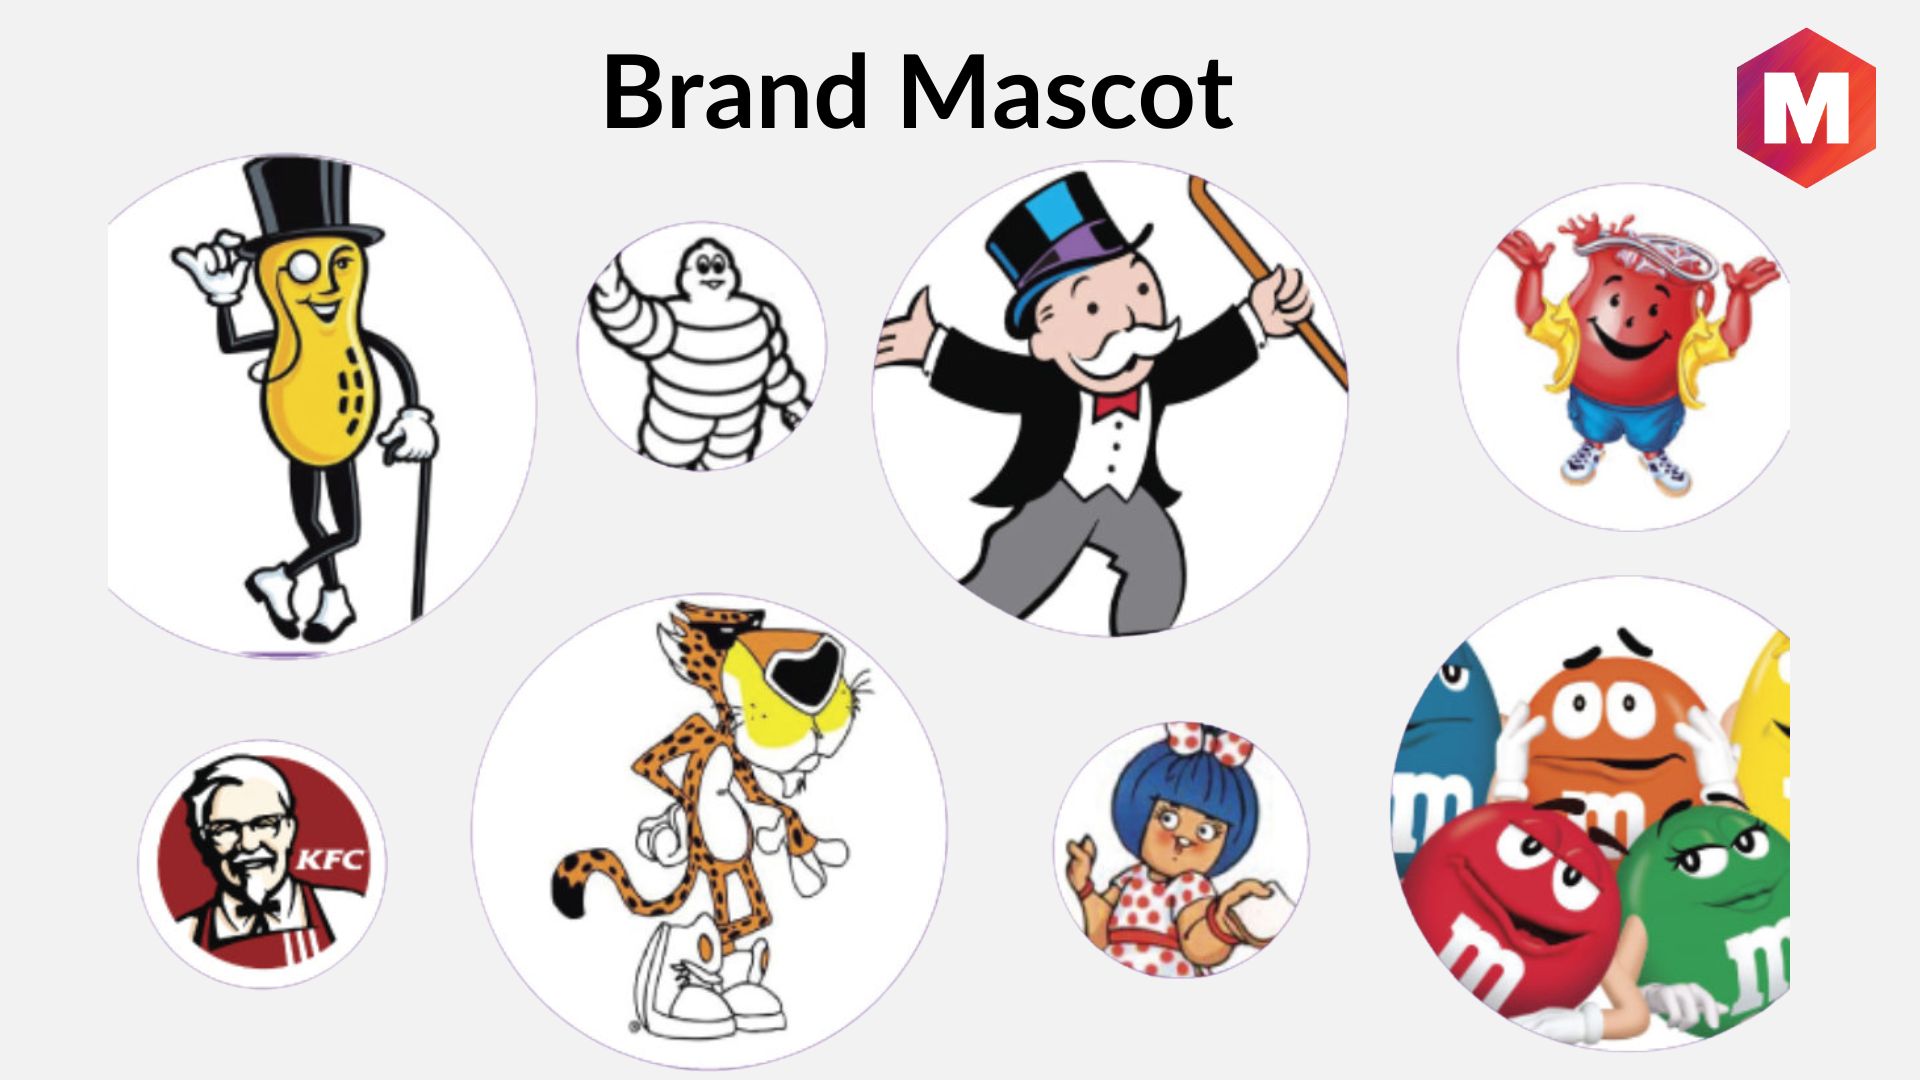
What is a Brand Mascot? A Brand Mascot is a character that is used to represent a company or product. Brand mascots can be human,…
Brand Packaging: Definition, Steps, Usage & Examples
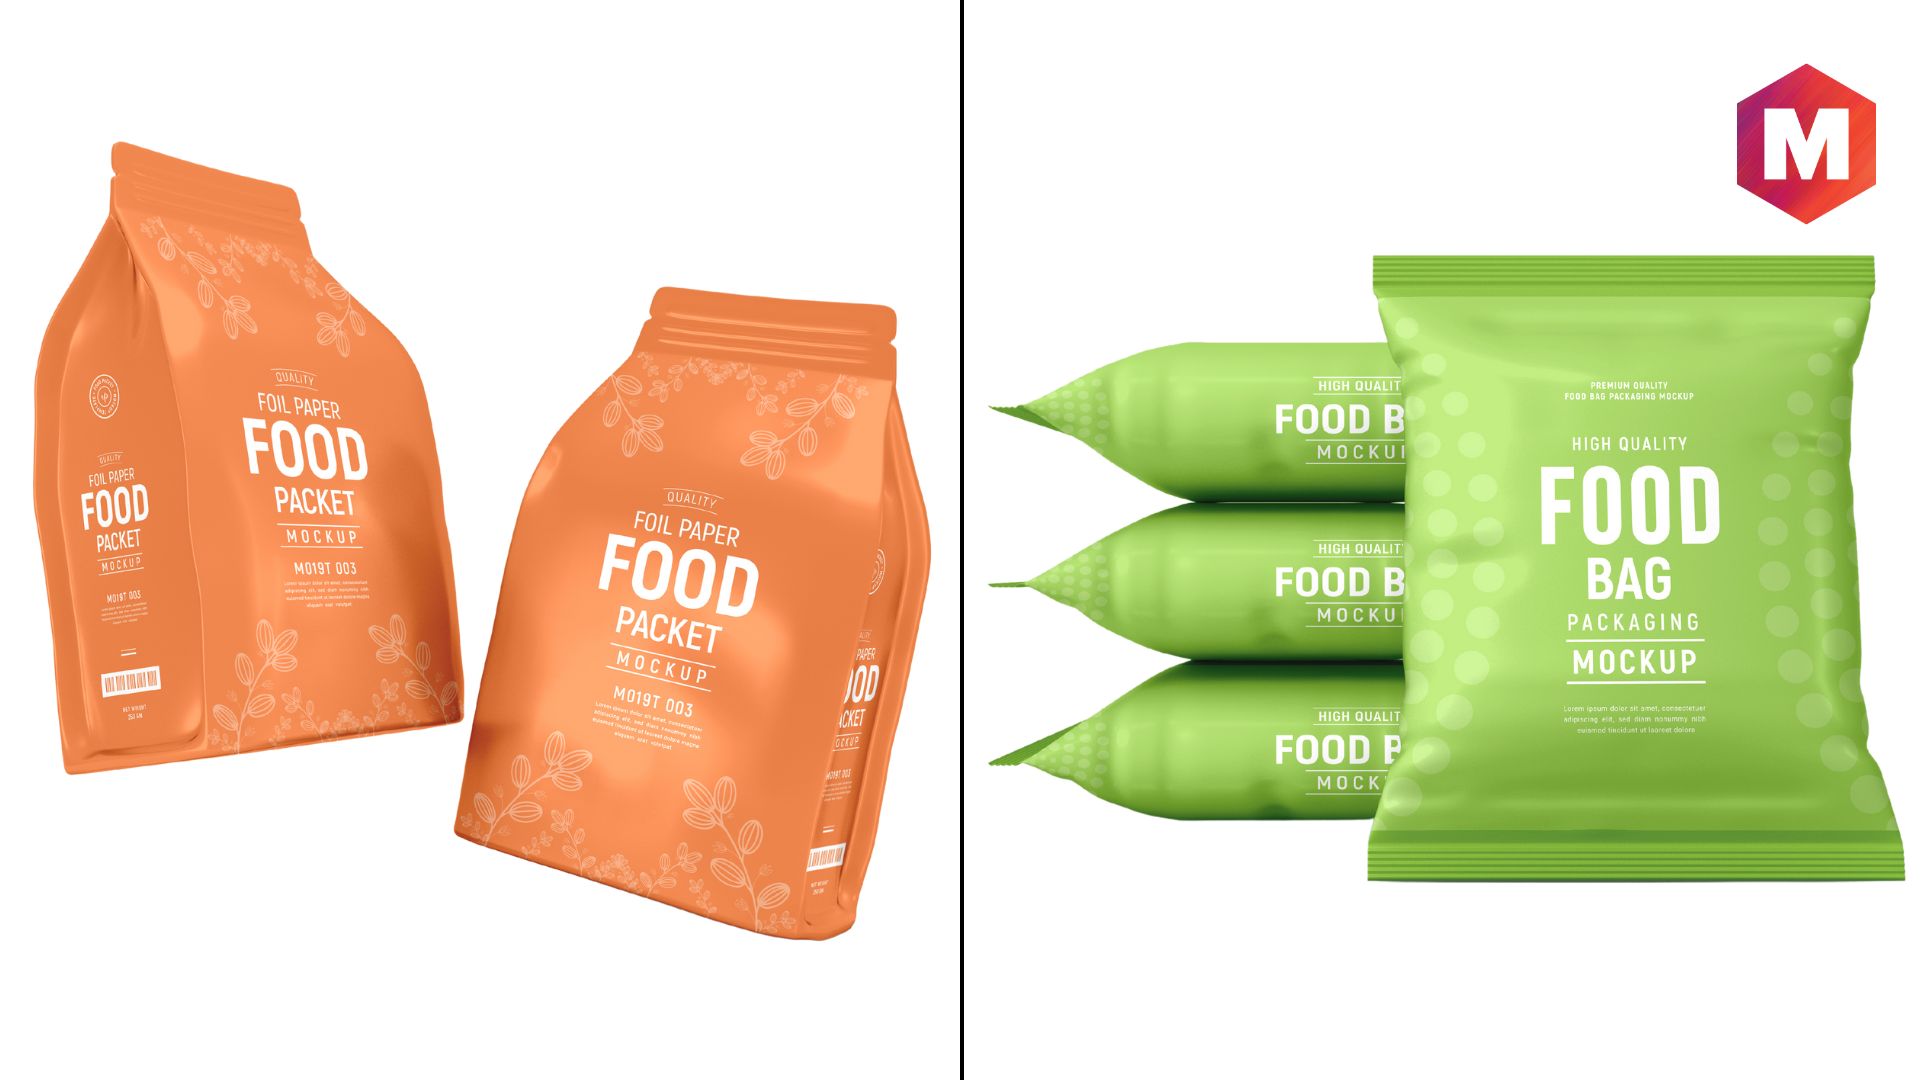
What is Brand Packaging? Brand packaging is the process of creating and designing the packaging for a brand that includes branding elements such as a…
Brand Hierarchy: Definition, Types, Models and Examples
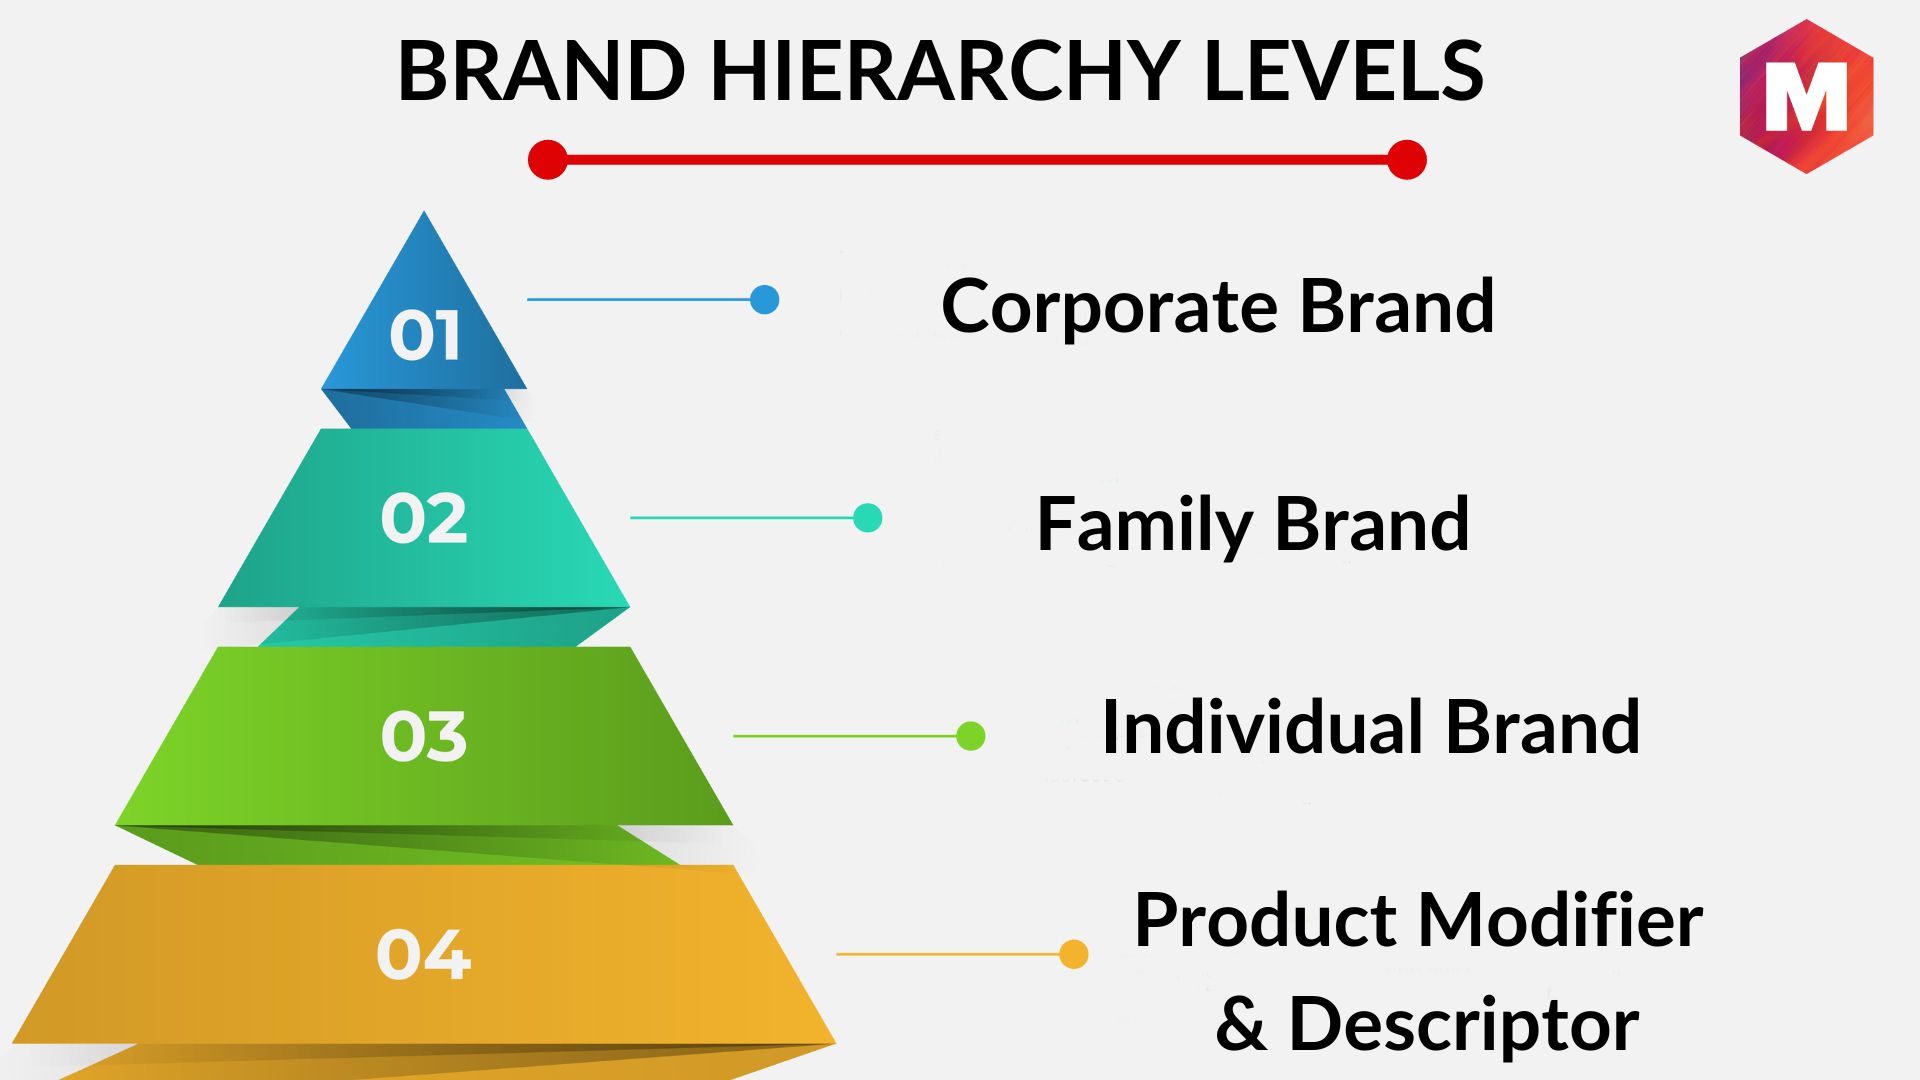
What Is Brand Hierarchy? Brand hierarchy is the organizational structure of a company’s brand portfolio. It outlines the relationships between a brand’s different elements, and…
The Brand Value Chain
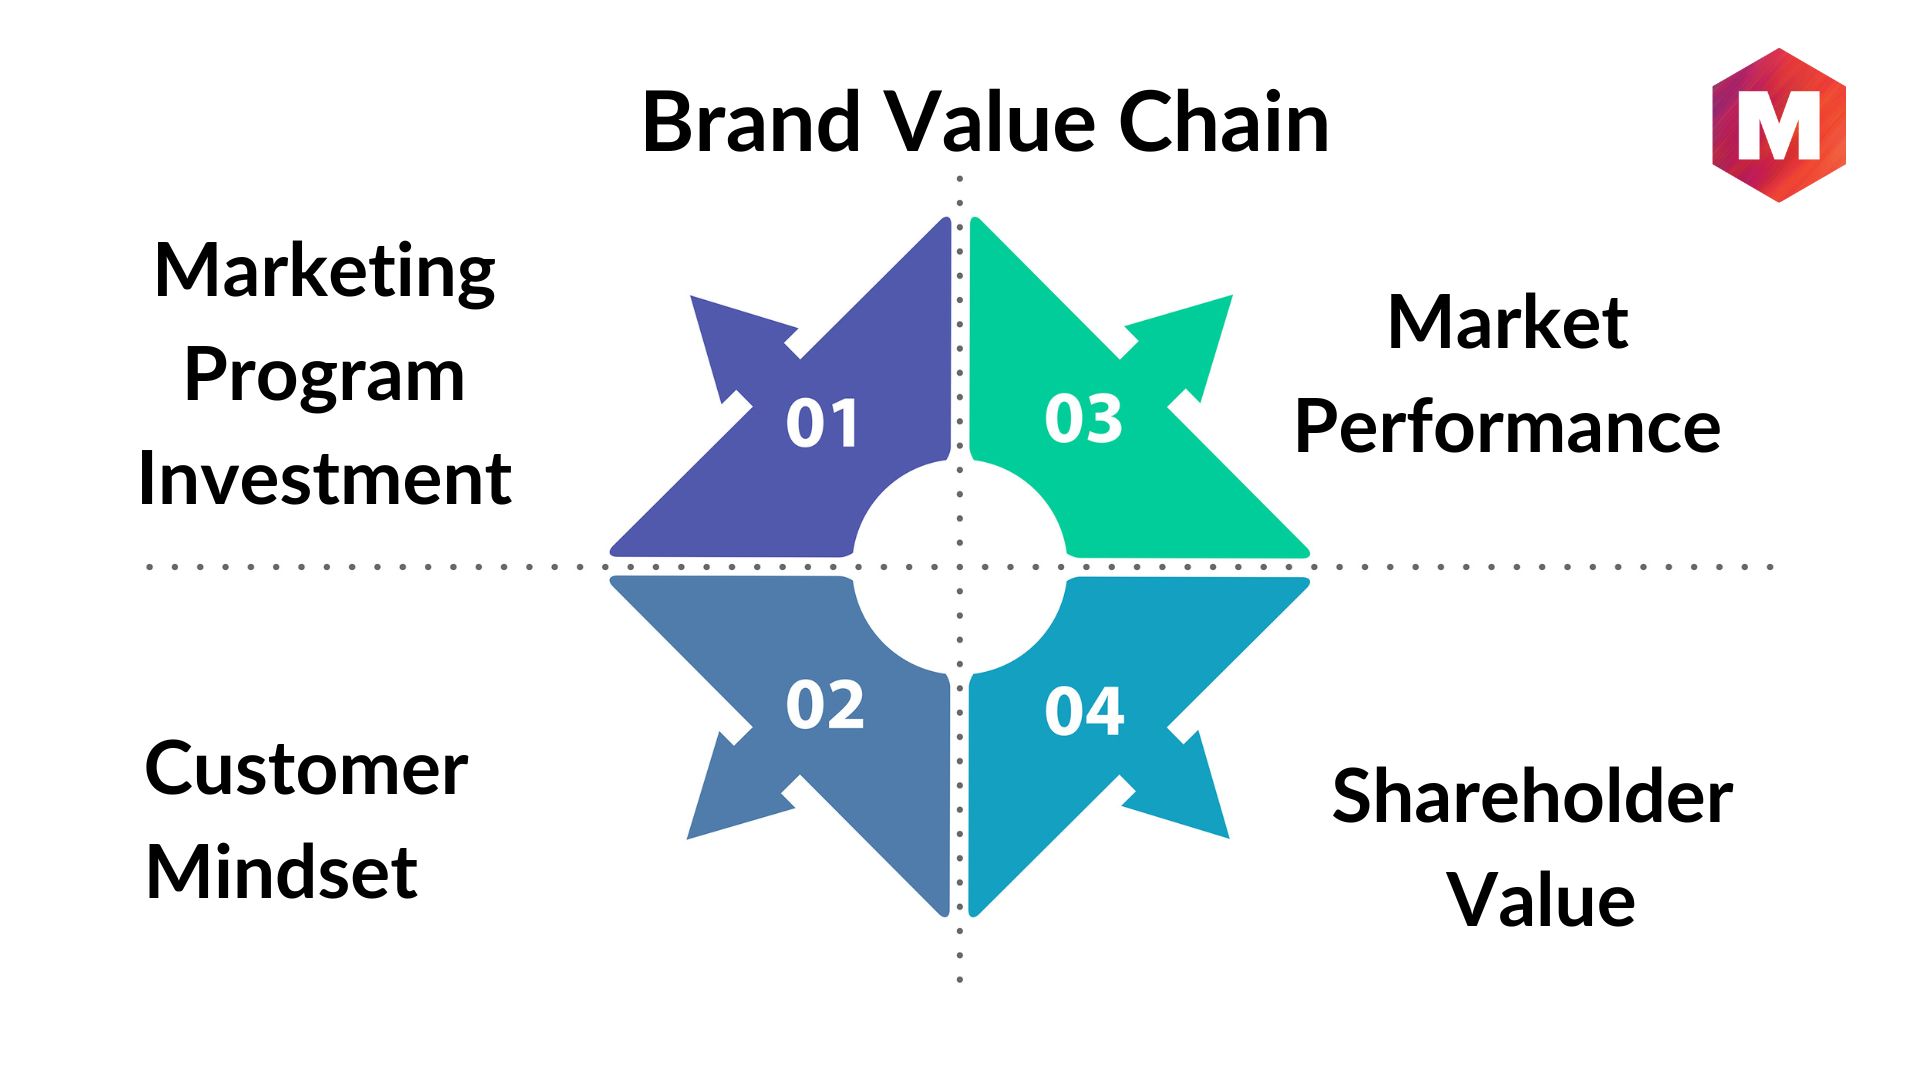
What is a Brand Value Chain? A brand value chain is a framework that helps businesses understand how value is created, delivered, and captured within…
How to Manage Brand Equity?
What is Brand Equity? Brand equity is the brand-perceived value that a company has built up over time. This value is based on positive customer…
The 12 Brand Archetypes Explained with Examples
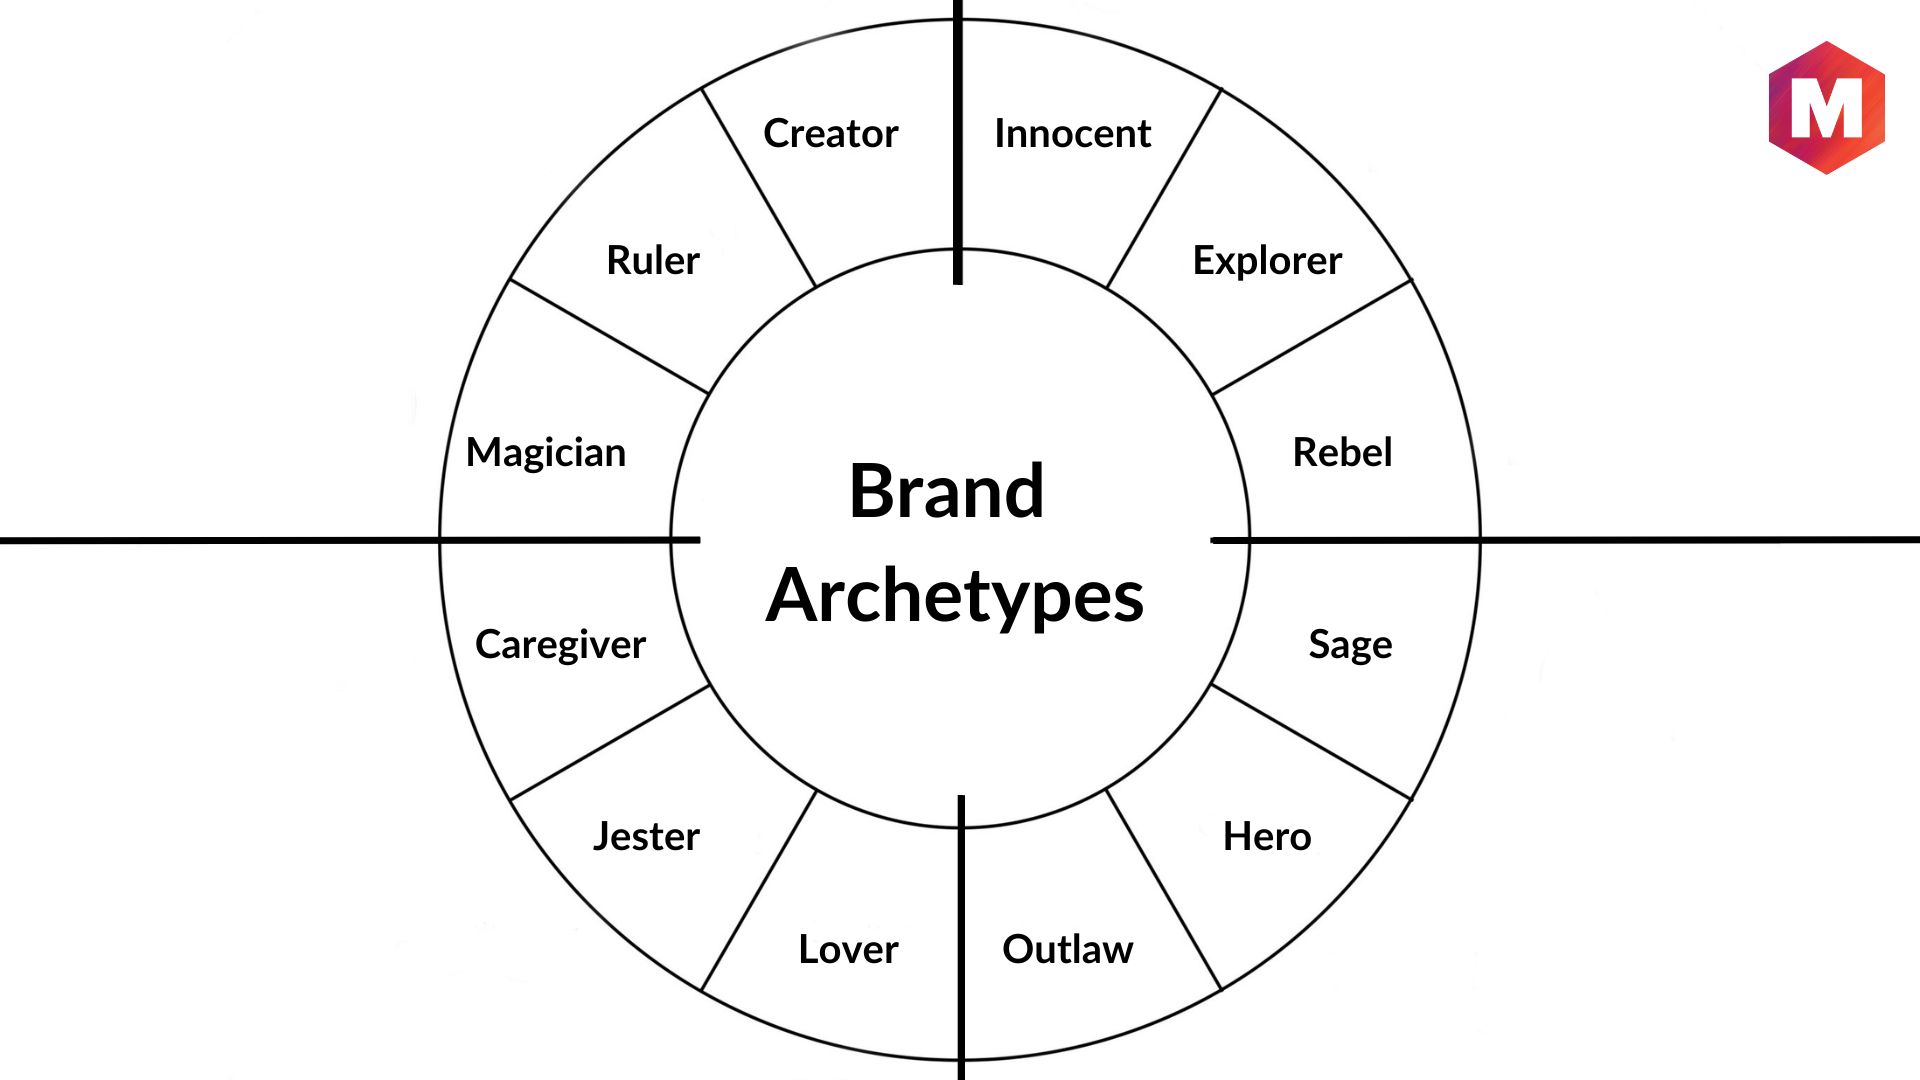
What are brand archetypes? Brand archetypes are universal symbols or characters that help create a brand identity and convey brand values as a persona. By…
What is a Brand Bible and How to Build One?

What is a Brand Bible? A Brand Bible is the definitive source for a company’s brand design, treatments, and fundamentals. Brand bibles are essential to…
Individual Branding: Definition, Examples, Strategies & Tips

What is Individual Branding? Individual Branding is the process of creating, developing, and promoting a brand identity that is uniquely associated with an individual product…
What is a Brand Deck and How to Build One?

What is a Brand Deck? A brand deck is an overview of your entire brand, typically including visuals such as logos, colors, fonts, and imagery…
13 Amazing Brand Identity Examples

What is Brand Identity? Brand identity is a unique set of characteristics that distinguish one brand from another. Brand identity includes visuals such as logos,…
Points of Difference (POD): Definition, Types and Benefits

What are Points of Difference? Points of difference are the unique characteristics that distinguish a product or service from other competitors in the market. These…